I’m currently migrating a large website from Handlebars to Nunjucks. Since the website is being updated daily, and because there are too many pages, I can’t convert the Handlebars syntax to Nunjucks syntax manually. To solve this, I started writing a script to convert the syntax programmatically using JavaScript (nodeJS). So far, it’s working very well. Here’s how I’m doing it, and how you can do something similar when confronted with a migration project.
Basically, the way it works is
it recursively finds all files in a folder called “temp”
if the file path ends with “hbs” – indicating it is a Handlebars file – then for each file, it executes a series of regex search and replace commands, e.g.
replace {{#if class}} with {% if class %}
replace {{/if}} with {% endif %}
and so on.
Those are simple search-and-replace situations. There may be a situation where you’ll need an advanced search and replace, e.g. when replacing
{{> social-list
    dark="true"
    centered="true"}}
with
{% set dark="true" %}
{% set centered="true" %}
{% include social-list.njk %}
In this case, you can use a “replacer” function, which allows you to do much more to manipulate the output.
When you’re all done and you’ve built the HTML files from both the handlebars templates and the nunjucks templates, you can write a script that recursively reads all HTML files in the build output folder and lists each HTML file path generated from each handlebars and nunjucks template along with their respective file size. The file sizes should be the same or almost the same. If some are not, then the migration script didn’t convert those templates correctly. Maybe something like:
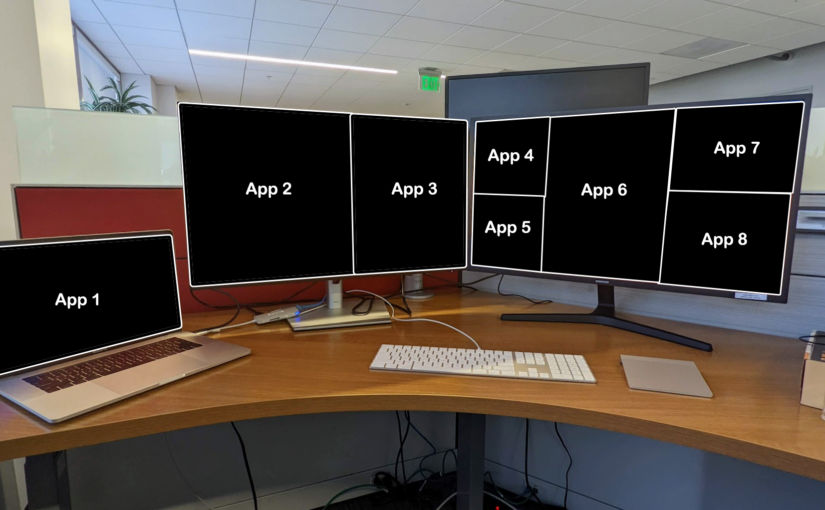
With so many people working both from home and at the office, it can become annoying to have to rearrange your application windows when you move between the two locations. This is especially true for people like me who need multiple monitors, two of which are 32″ 4K ones as shown below, which I need to display multiple windows on each screen.
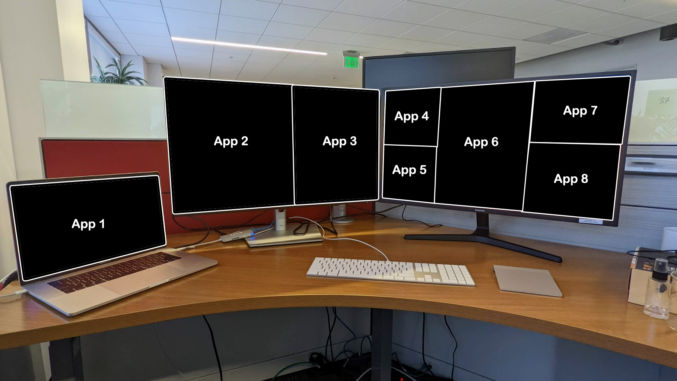
Though I have a similar setup at home, my application windows always get jumbled up when I move between locations, possibly because the standalone monitors are not all the same brand with the same exact resolution.
Most window management apps allow you to move and resize windows in a grid, e.g.
left 50% of screen,
bottom 50% of screen,
right 33% of screen,
top 50%, left 50% of screen,
etc
These are fine if you aren’t going to move locations often and don’t have too many windows. If you want the same layout spanning multiple monitors and the ability to instantly move and resize all windows to that layout, then I recommend Moom. Here’s how to use Moom to save layouts for multiple monitor configurations.
At location 1, e.g. work, open your applications and arrange them how you like
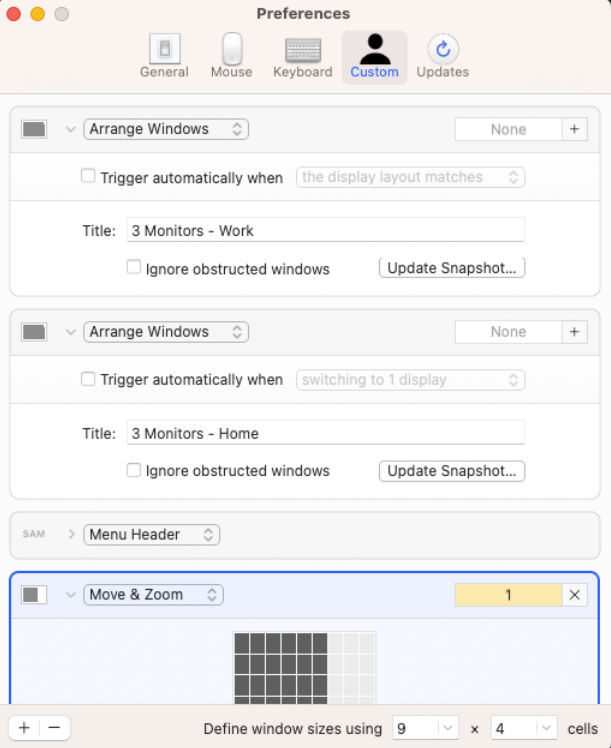
Open Moom and create a custom preset with the following settings
Type: Arrange Windows
Name: I put “3 Monitors – Work”
Uncheck all checkboxes
Click “Update Snapshot”
This saves the layout as a preset. To test it, resize and move all your windows around. Then, hover over the green dot in any one window and click on the preset. All windows will instantly move to how you had them.
When you’re at home, you can create another preset and call it something like “3 Monitors – Home”. Now, you no longer have to mess around with moving windows around. Just click on a preset from any open window and get back to business.
Moom has a one-time cost of $10, but it’s obviously worth it.
In this tutorial, I will explain how we can fetch remote paginated JSON data synchronously (in serial) and asynchronously (in parallel).
Data
You can get test data to fetch from RapidAPI, but I’m going to fetch video data from Vimeo using the Vimeo API.
Fetch Method
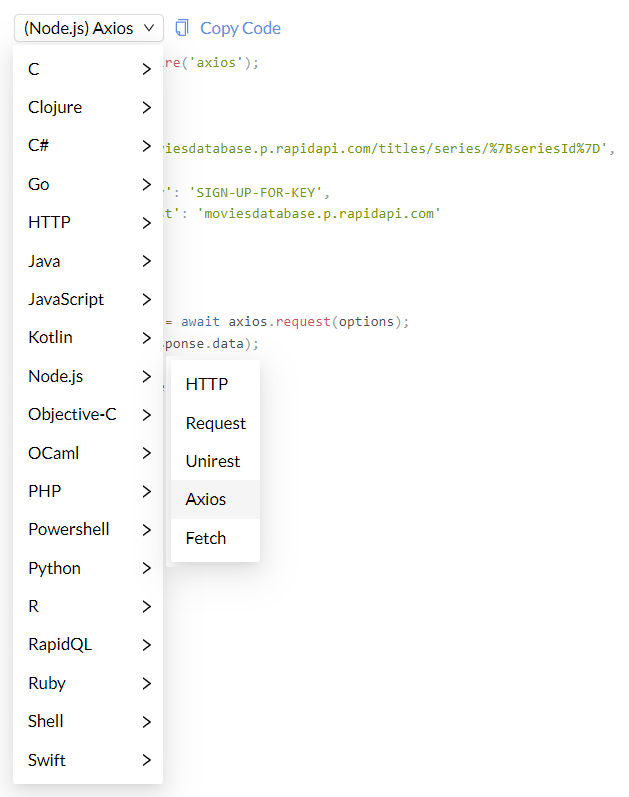
There are many ways you can fetch remote data. The RapidAPI website provides code snippets for various languages and fetch methods. For example, for Node.js, there’s HTTP, Request, Unirest, Axios, and Fetch.
Some services like Vimeo provide libraries and SDKs in a few languages like PHP, Python and Node.js. You can use those as well if you’d like.
I’m actually going to use the Got library [GitHub], which is a very popular library.
CommonJS vs ESM
Many of the latest Node packages are now native ESM instead of CommonJS. Therefore, you can’t require modules like this
const got = require('got');
Instead, you must import modules like this
import got from 'got';
According to this page, you can convert your project to ESM or use an older version of the got package that uses CommonJS.
If using ESM, you need to put "type": "module" in your package.json.
Authentication
Many services like Vimeo require authentication in order to use their API. This often involves creating an access token and passing it in the header of the API call like this
GET /tutorial HTTP/1.1
  Host: api.vimeo.com
  Authorization: bearer {access_token}
Setup
Let’s set up our project. Do the following:
Create a new folder, e.g. test
Open the folder in a code editor (I’m using VisualStudio Code)
Open a terminal (I’m doing it in VS Code)
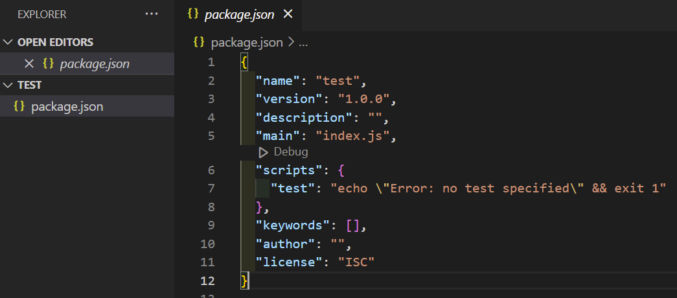
Initialize a Node project by running npm init -y
This will generate a package.json file in the folder.
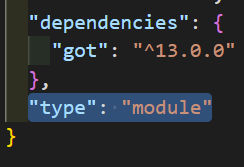
Since we’re using ESM and will import modules rather than require them, add the following to the package.json file.
"type": "module"
Call the Vimeo API
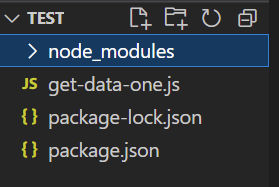
Let’s start by calling the Vimeo API just once. Create a new file called get-data-one.js and copy the following contents into it. Replace {user_id} with your Vimeo user ID and {access_token} with your Vimeo access token.
import got from 'got';

let page = 1;
let per_page = 3;
let fields = "privacy,link,release_time,tags,name,description,download";

const url = `https://api.vimeo.com/users/{user_id}/videos?page=${page}&per_page=${per_page}&fields=${fields}`;
const options = {
  method: 'GET',
  headers: {
    'Authorization': 'bearer {access_token}'
  }
};

let data = await got(url, options).json();
console.log(data);
We’re importing the got library. For this to work, we need to install the got package. Run the following command.
npm install got
This will download the got package and its dependencies into the node_modules folder.
In the code, the Vimeo endpoint we’re calling is /users/{user_id}/videos, which returns all videos that a user has uploaded. According to the API docs, we can
Specify the page number of the results to show using page
Specify the number of items to show on each page of results, up to a maximum of 100, using per_page
Specify which fields to return using fields
These parameters can be added to the endpoint URL in the query string, which is what we’ve done. However, for this test, we’ll just call one page and return the records (videos). We then call the API using the got library and then dump the results to the console. Let’s run the script and check the output. Run the following command.
node get-data-one.js
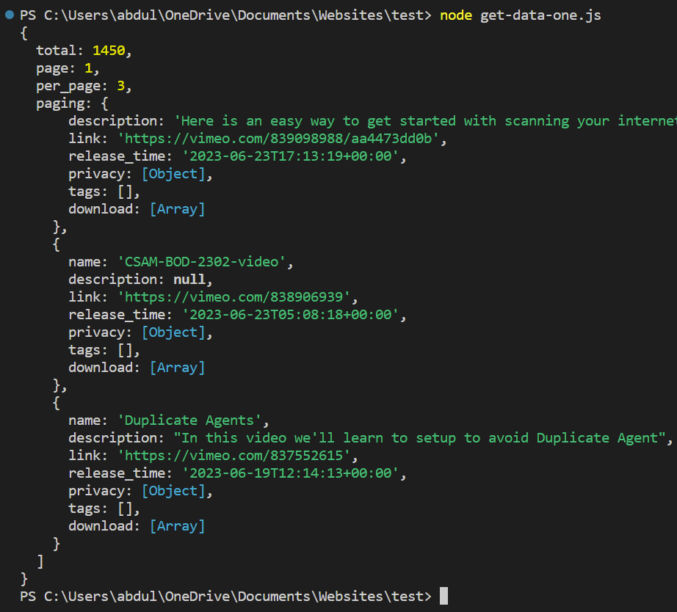
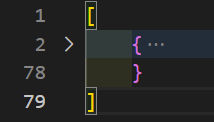
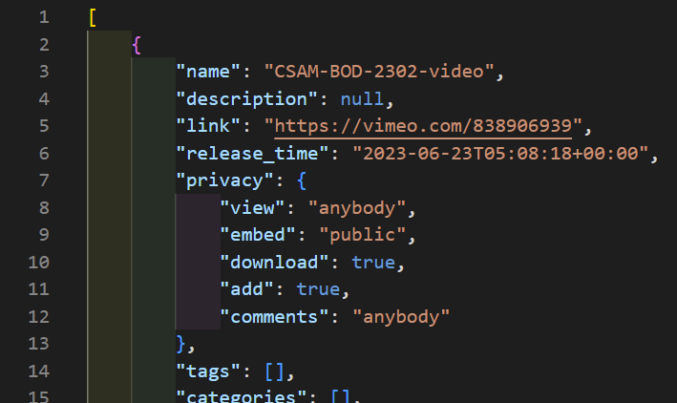
As expected, here’s the output.
The output starts with pagination info and the total number of available records (videos) followed by the actual data in the form of an array of video objects. In this case, we see 3 objects because we set per_page to 3.
Let’s update our code to write the output to a file. That will make it easier to read when there’s a lot of data. Add the following code snippets
import fs from "fs";
var stream = fs.createWriteStream("video-data.json",{flags:'w'});
    stream.once('open', function(fd) {
    stream.write(JSON.stringify(data)+"\n");
    stream.end();
});
so the code looks like this:
import fs from "fs";
import got from 'got';

let page = 1;
let per_page = 2;
let fields = "privacy,link,release_time,tags,name,description,download";

const url = `https://api.vimeo.com/users/{user_id}/videos?page=${page}&per_page=${per_page}&fields=${fields}`;
const options = {
  method: 'GET',
  headers: {
    'Authorization': 'bearer {access_token}'
  }
};

let data = await got(url, options).json();
console.log(data);
var stream = fs.createWriteStream("video-data.json",{flags:'w'});
    stream.once('open', function(fd) {
    stream.write(JSON.stringify(data)+"\n");
    stream.end();
});
We don’t need to install the fs package because that’s included in Node by default. The stream will write data to a file we’ll call video-data.json and we pass it the “w” flag to overwrite any existing contents of the file.
When we rerun the script, we see the file is created. We can format (prettify) it so it’s easy to read.
Call the Vimeo API Multiple Times in Serial with Pagination
Now, let’s say we want to fetch more data, but the API limits how many records are returned in a single call. In this case, we need to call the API in a loop passing a different page number. Let’s create a new file called get-data-serial.js with the following code.
import fs from "fs";
import got from 'got';

let data = [];
let per_page = 2;
let fields = "privacy,link,release_time,tags,name,description,download";
const options = {
    method: 'GET',
    headers: {
      'Authorization': 'bearer {access_token}'
    }
}

for(let page = 1; page <= 3; page++) {
    const url = `https://api.vimeo.com/users/{user_id}/videos?page=${page}&per_page=${per_page}&fields=${fields}`;

    let somedata = await got(url, options).json();
    data.push(somedata);
    console.log(page);
};

console.log(data);
var stream = fs.createWriteStream("video-data.json",{flags:'w'});
    stream.once('open', function(fd) {
    stream.write(JSON.stringify(data)+"\n");
    stream.end();
});
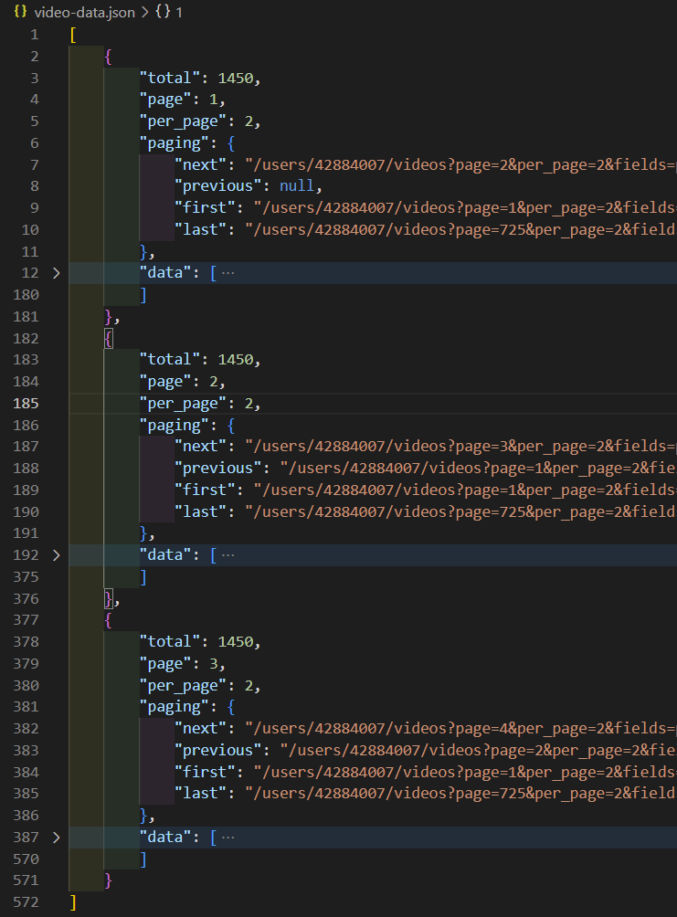
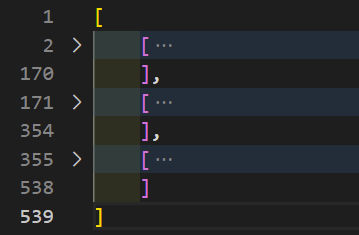
Here, I’m using a simple for loop to loop through 3 pages. I also created a data variable as an empty array. With each loop iteration, I push the page’s returned data to the data array. When all is done, I write the data array to a file, which looks like this.
I collapsed the “data” array so we can see that 3 pages of data were returned. We ran this in serial so the order of the output is page 1, page 2, and page 3.
Call the Vimeo API Multiple Times in Parallel with Pagination
Now, let’s do the same thing, but asynchronously (in parallel). Create a new file called get-data-parallel.js with the following code.
import fs from "fs";
import got from 'got';

const options = {
    method: 'GET',
    headers: {
    'Authorization': 'bearer {access_token}'
    }
};

let data = [];
let per_page = 2;
let fields = "privacy,link,release_time,tags,name,description,download";
let pages = [1,2,3];

await Promise.all(pages.map(async (page) => {
    const url = `https://api.vimeo.com/users/{user_id}/videos?page=${page}&per_page=2&fields=privacy,link,release_time,tags,name,description,download`;

    let somedata = await got(url, options).json();
    data.push(somedata);
    console.log(page);
}));

console.log(data);
var stream = fs.createWriteStream("video-data-parallel.json",{flags:'w'});
    stream.once('open', function(fd) {
    stream.write(JSON.stringify(data)+"\n");
    stream.end();
});
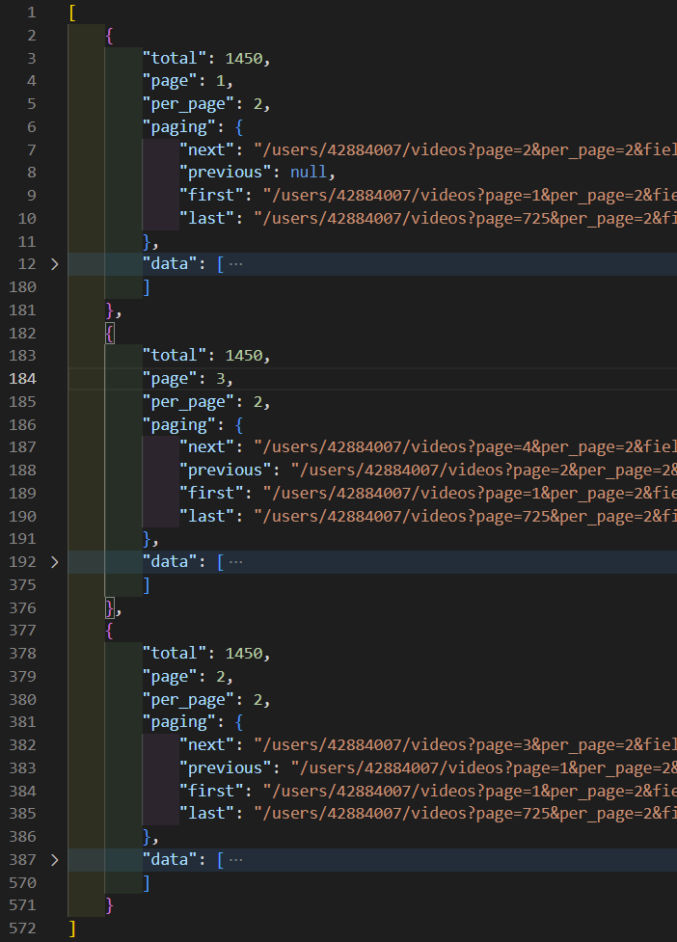
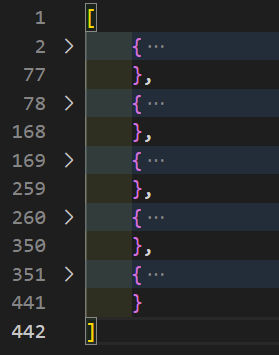
In this case, instead of a for loop, we’re using Promise.all and passing to it an array of page numbers that we loop over using the map function. When we run the script, we get output like the following:
You’ll notice 2 things:
the script runs faster because the API calls are done simultaneously in parallel (asynchronously) rather than one after the other in serial (synchronously).
the order of the output is no longer consecutive by page number. In this example, it was page 1, page 3, page 2.
Modifying the JSON Output Structure
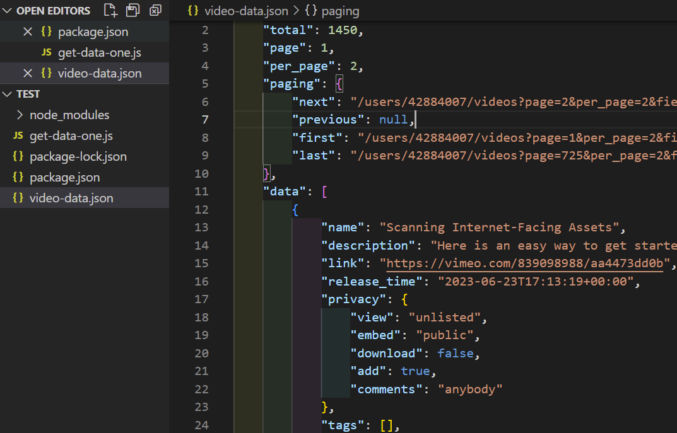
As shown in the previous screenshot, the API call returns an object containing pagination info followed by a data array – an array of objects containing video info.
What if we just want the data objects and not the pagination info. We can do that by modifying the structure of the JSON output. We can replace
data.push(somedata);
with
data.push(somedata.data);
but then the output becomes an array of arrays.
To fix this, let’s flatten the array by adding the following code:
data = data.flat(1);
right before we console it out and write to file.
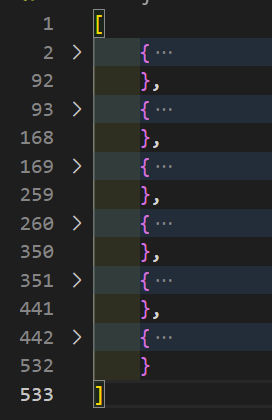
Now, the output file looks like this (each record is collapsed for visibility).
Filtering Out Certain Records
What if we want to filter out certain records, e.g. we want to filter out all videos that are not public, i.e. we only want videos where privacy.view = “anybody”. We can use the filter function to do that, like this:
Each video record can contain a lot of information, including information we don’t need. For example, the privacy object contains 5 keys.
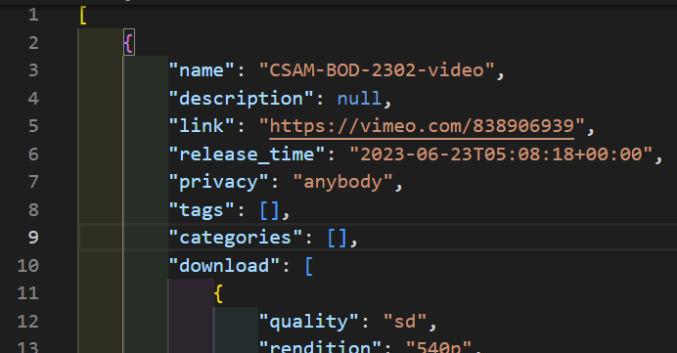
If we want to return just one privacy key, say “view”, then we can do so using the map function as follows:
// simplify privacy object to just privacy.view
somedata = somedata.map(function (video) {
video.privacy = video.privacy.view;
return video;
});
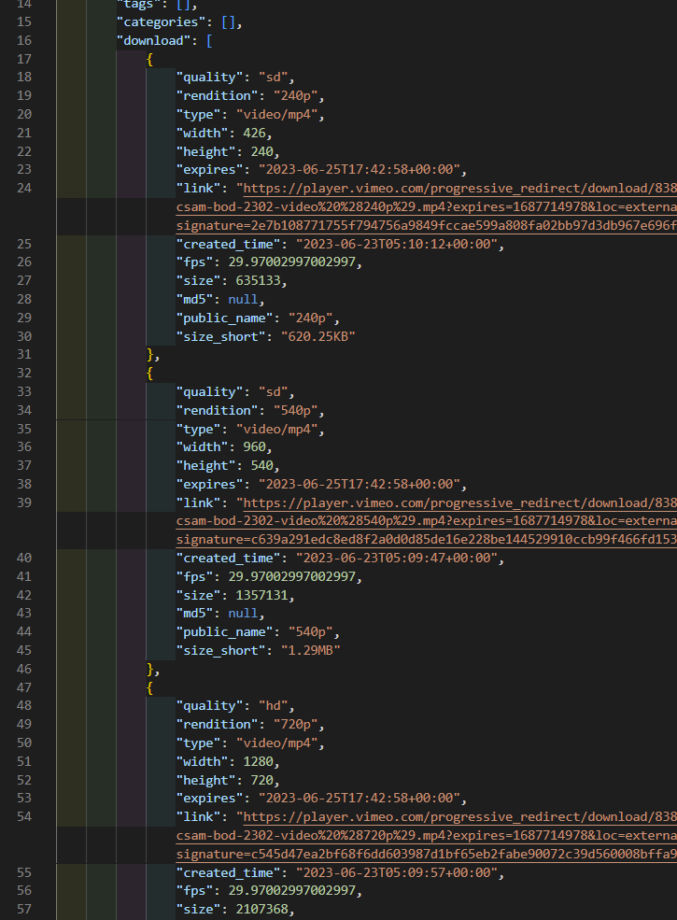
For each video record, the “download” field is an array of objects, one for each available rendition (resolution), e.g.
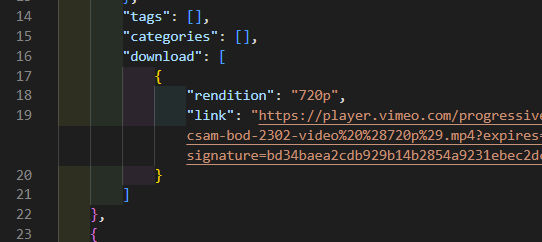
If we only want to, say, return “hd” videos and only the download links, we can use two map functions like this:
// only include videos that are HD and only return HD video download links
somedata = somedata.map(function (video) {
let download = [];
video.download.map(function (size) {
if (size.quality === "hd") {
download.push({
rendition: size.rendition,
link: size.link
})
}
});
if (download.length !== 0) {
video.download = download;
return video;
}
});
Now, the downloads array is simplified, like this:
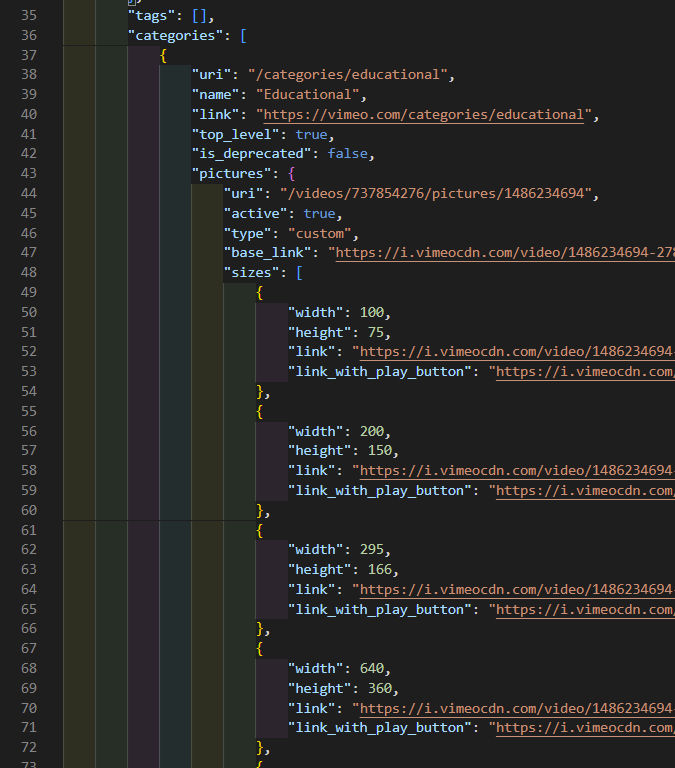
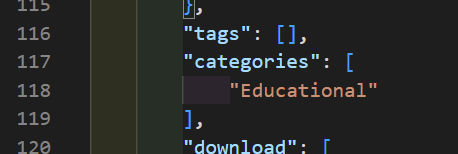
The “categories” field is an array of objects with a lot of data, including objects and arrays of objects.
What if we want to simplify that to just a comma-delimited list of category names. We can do that like this:
For reference, here’s the complete code for get-data-serial.js. The page limit and per_page values can be updated depending on how many results you want.
import fs from "fs";
import got from 'got';
let data = [];
let per_page = 2;
let fields = "privacy,link,release_time,tags,name,description,download,categories";
const options = {
method: 'GET',
headers: {
'Authorization': 'bearer {access_token}'
}
}
for(let page = 1; page <= 3; page++) {
const url = `https://api.vimeo.com/users/{user_id}/videos?page=${page}&per_page=${per_page}&fields=${fields}`;
let somedata = await got(url, options).json();
somedata = somedata.data;
// only include videos that are public
somedata = somedata.filter(video => video.privacy.view === "anybody" );
// only include videos that aren't in the "Educational" category
somedata = somedata.filter(function (video, index, arr) {
    let isEducational = false;
    video.categories.filter(function (category, index, arr) {
        if (category.name === "Educational") {
            isEducational = true;
        }
    });

    if (isEducational === false) {
        return video;
    }
});
// simplify privacy object to just privacy.view
somedata = somedata.map(function (video) {
    video.privacy = video.privacy.view;
    return video;
});
// only include videos that are HD and only return HD video download links
somedata = somedata.map(function (video) {
    let download = [];

    video.download.map(function (size) {
        if (size.quality === "hd") {
            download.push({
                rendition: size.rendition,
                link: size.link
            })
        }
    });

    if (download.length !== 0) {
        video.download = download;
        return video;
    }
});
// simplify categories array of objects to just an array of category names
somedata = somedata.map(function (video) {
    let categories = [];

    if (video !== undefined) {
        video.categories.map(function (category) {
            categories.push(category.name);
        });

        video.categories = categories;
        return video;
    }
});
data.push(somedata);
console.log(page);
};
data = data.flat(1);
console.log(data);
var stream = fs.createWriteStream("video-data.json",{flags:'w'});
stream.once('open', function(fd) {
stream.write(JSON.stringify(data)+"\n");
stream.end();
});
Most websites contain the same or very similar layouts on multiple pages, e.g. header and footer. There also might be a few different hero section designs and a few different CTA section designs. Imagine having 10 product pages each containing three 2-column sections with a text description in the left column and a screenshot in the right column. Each of these product pages may also have a CTA section design but with slightly different text and links. It’s common to put shared CSS in a shared CSS file, e.g. shared.css, common.css, or global.css. This especially makes sense for the header and footer, which are usually shown on all pages. But over time, that shared CSS file can become very long because you may have a lot of CSS for many different common sections. This can make it difficult and dangerous to edit code for just one particular section. It can also make it very difficult if you want to copy a section on one page to add to another page. If the HTML, CSS, and JS for the section aren’t isolated, you may not copy all the necessary code, not to mention you could end up with inconsistencies between two or more sections that should have the same design.
Consolidating all CSS into the fewest files possible is good for website performance (the fewer files, the fewer network requests), but nowadays, it’s common for websites, including simple static websites, to go through an automated build process to optimize the files before publishing them. The build process can do many things like minify and combine multiple CSS and JS files into single CSS and JS files, add prefixes to CSS using tools like PostCSS auto-prefixer, etc.
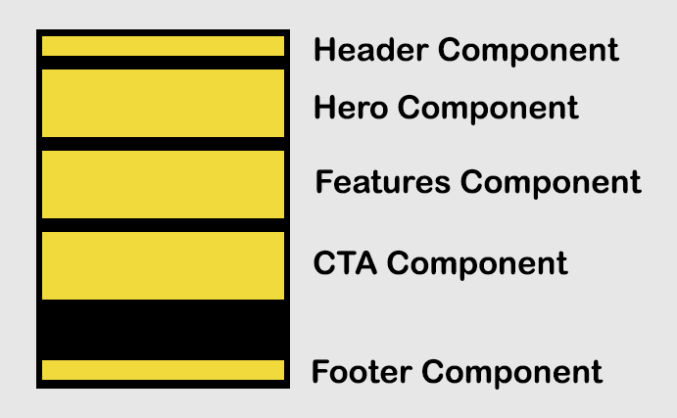
Following is one simple approach to grouping HTML, CSS and JS by website section. This approach can also be used for any part of a website like blocks within a section, but to keep things simple, we’ll just look at sections which I define as horizontal rows of related content, e.g.
In the src (source) folder, I’m using Nunjucks (njk) files instead of HTML files so they can include logic and pull in the components (partials). When the source files are processed, the built HTML files show up in the “build” folder. For the home page source file (index.njk), the structure of the code could be like this
<html>
<head>

    {% include "/src/components/header/header.css" %}
    {% include "/src/components/footer/footer.css" %}
    {% include "/src/index.css" %}
</head>
<body>
    {% include "/src/components/header/header.njk" %}

    ... some HTML ...

    {% include "/src/components/footer/footer.njk" %}

    {% include "/src/components/header/header.js" %}
    {% include "/src/components/footer/footer.js" %}
    {% include "/src/index.js" %}
</body>
</html>
Note that the home page has its own CSS and JS files for elements that are not part of a component. When this file is built, the CSS and JS files will be combined (Netlify can do this automatically) and the included header and footer njk references will be replaced with their contents, e.g.
Here’s another example. For product page 1 (product1/index.njk), the file contents may look like this
<html>
<head>

    {% include "/src/components/header/header.css" %}
    {% include "/src/components/section1/section1.css" %}
    {% include "/src/components/section4/section4.css" %}
    {% include "/src/components/footer/footer.css" %}
    {% include "/src/product1/index.css" %}
</head>
<body>
    {% include "/src/components/header/header.njk" %}

    {% set title = "Product 1" %}
    {% set heroImage = "product1.jpg" %}
    {% include "/src/components/section1/section1.njk" %}

    ... some HTML ...

    {% set text = "Try Product 1 Now" %}
    {% set link = "/product1/free-trial/" %}
    {% include "/src/components/section4/section4.njk" %}

    {% include "/src/components/footer/footer.njk" %}

    {% include "/src/components/header/header.js" %}
    {% include "/src/components/section1/section1.js" %}
    {% include "/src/components/section4/section4.js" %}
    {% include "/src/components/footer/footer.js" %}
    {% include "/src/product1/index.js" %}
</body>
</html>
In the code example above, we’re passing some variables into components section1 and section 4. That allows us to reuse a component’s layout and design while changing its content. Since product pages usually look very similar, the code for product2/index.njk might look like this
<html>
<head>

    {% include "/src/components/header/header.css" %}
    {% include "/src/components/section1/section1.css" %}
    {% include "/src/components/section4/section4.css" %}
    {% include "/src/components/header/footer.css" %}
    {% include "/src/product2/index.css" %}
</head>
<body>
    {% include "/src/components/header/header.njk" %}

    {% set title = "Product 2" %}
    {% set heroImage = "product2.jpg" %}
    {% include "/src/components/section1/section1.njk" %}

    ... some HTML ...

    {% set text = "Try Product 2 Now" %}
    {% set link = "/product2/free-trial/" %}
    {% include "/src/components/section4/section4.njk" %}

    {% include "/src/components/footer/footer.njk" %}

    {% include "/src/components/header/header.js" %}
    {% include "/src/components/section1/section1.js" %}
    {% include "/src/components/section4/section4.js" %}
    {% include "/src/components/footer/footer.js" %}
    {% include "/src/product2/index.js" %}
</body>
</html>
I reused the components but changed the value of the variables that are referenced in the components.
To prevent code conflicts, you can specify an ID in the first element of each component. For example,
section1.njk
<div id="section1">
    ... some HTML ...
    {{text}}
    {{link}}
</div>
section2.njk
<div id="section2">
    ... some HTML ...
    {{text}}
    {{link}}
</div>
Then, in the component’s CSS, to prevent CSS conflicts, you can prefix all rules like this
section1.css
#section1 .intro {
    ... some CSS ...
}

#section1 .features {
    ... some CSS ...
}
section2.css
#section2 .intro {
    ... some CSS ...
}

#section2 .features {
    ... some CSS ...
}
Similarly, with the JavaScript component file, you can do something similar, e.g.
section1.js
$("#section1 .intro")...
section2.js
$("#section2 .intro")...
Another benefit of this approach is you can create a page showing a preview of all components you have. When you want to create a new page, you can browse the list of component previews to see if you can reuse an existing component or decide if you need to create a new component.
Separate content from design
In the examples above, we’re specifying content in variables above each “include”. This can result in a very long template. A better approach is to move the content to a separate data file in JSON format. Let’s update our file structure as follows:
one for the “hero” section / component (section1.njk),
one for the “features” section / component (section3.njk),
one for the “testimonials” section / component (section4.njk)
To get the component files (section1.njk, section2.njk) to read the data from the data files (product1/index.data.json, product2/index.data.json), we’ll need to update the syntax a bit.
For product page 1 (product1/index.njk), the file contents may look like this
<html>
<head>

    {% include "/src/components/header/header.css" %}
    {% include "/src/components/section1/section1.css" %}
    {% include "/src/components/section4/section4.css" %}
    {% include "/src/components/footer/footer.css" %}
    {% include "/src/product1/index.css" %}
</head>
<body>
    {% include "/src/components/header/header.njk" %}

    {{> /src/components/hero page.hero }}

    ... some HTML ...

    {{> /src/components/section3 page.features }}

    ... some HTML ...

    {{> /src/components/section4 page.testimonails }}

    {% include "/src/components/footer/footer.njk" %}

    {% include "/src/components/header/header.js" %}
    {% include "/src/components/section1/section1.js" %}
    {% include "/src/components/section4/section4.js" %}
    {% include "/src/components/footer/footer.js" %}
    {% include "/src/product1/index.js" %}
</body>
</html>
Note that were passing page.hero, page.features, and page.testimonials, which only contains the JSON data for those sections, to their respective components (hero.njk, section3.njk, section4.njk).
The corresponding component files may look like this
Cherry-picking individual commits to merge them from one git branch to another is a very common practice. For me, I usually cherry-pick one or more commits from a develop branch to a master / main branch. The problem, however, is when I need to cherry-pick multiple commits made over a long period of time, like one month. Most git clients don’t make it easy to filter commits by keyword, and if they do, then they don’t let you easily select all filtered commits. So, back to the command line it is.
This post will describe one way to easily find all commits matching one or more keywords and extract their commit IDs on one line so you can quickly run the git cherry-pick command.
Step 1: Find and review filtered commits
We usually prefix our commit messages with an identifier so we can filter them amongst many other commits. For example, all commits to related to one project may have a commit message prefix of “LP:8929” where, in this case, “LP” stands for Landing Page. Sometimes, we might accidentally use an equal sign (=) instead of a colon (:). So, we’ll have one or more keywords to search commit messages when we filter all commits.
Furthermore, we usually cherry-pick commits from a develop branch to the master branch while we’re on master. The following command does the following:
Command
Description
git log
get the git log
master..develop
as we’re on the master branch, get the log from the develop branch
--oneline
format the output in one line (short format)
--grep='LP:8929' --grep='LP=8929‘
filter results to only results containing either ‘LP:8929’ or ‘LP=8929’
-i
do a case-insensitive search
git log master..develop --oneline --grep='LP:8929' --grep='LP=8929' -i
48b1cbcef51 LP:8929 - Fixed images path by using imagekit variable
8efa19678b3 LP:8929 - Fixed text alignment
3ab0954c725 LP:8929 - Updated banner and VS page on the landing page
bba58a1c5eb LP:8929 - Updated main heading of features section
fb56da3b134 LP:8929 - Updated content and created carousel as per the requirement
c7c6d50fbdb LP:8929 - Updated styling of the page
bc8a7fc38a1 LP:8929 - Updated icons of the comparison section
9a90ccb91ad LP:8929 - Updated text styling
a3bc0baf65f LP:8929 - Updated headshots and styling of the page
13977d2eb12 LP:8929 - Updated content as per the doc
7e589debba8 LP:8929 - First Pass: Created Landing page of Tenable v Qualys competitive page
Now that we have our list of commits, we need to review them to make sure they are correct. In our case, we primarily want to make sure the keywords are at the beginning of the commit message since that’s our commit message format.
Step 2: Extract commit IDs
If our list of commits is correct, then we need to extract the commit IDs. However, the git cherry-pick command requires the list of commit IDs to be in chronological order. By default, the git log output is in reverse chronological order. Here’s the updated command with some modifications.
Command
Description
--reverse
Reverse the git log output to chronological order
awk '{print $1}'
Extract only the text output in the first column (commit IDs)
Now that we have our list of commit IDs in the correct order, we can copy it, type “git cherry-pick” and paste the list to create a command like the following.
Svelte is a JavaScript framework similar to React, Vue, etc, but with some fundamental differences that I think make it better. It’s also much more intuitive to understand as the web component structure of the code is dead simple. When building an app using Svelte, you’re encouraged to use Sveltekit, the official Svelte application framework. But, if you just want a simple frontend-only site/app, then you can just use Svelte (without Kit). In doing so, you can then easily take the built CSS and JS files and include them in any existing web page. Then, you just add a simple div
<div id="app"></div>
in your existing HTML file where you want the app go to.
Here’s an example.
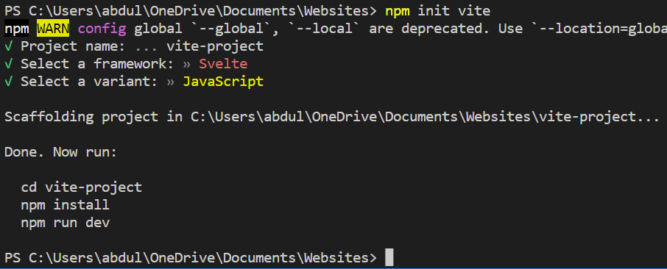
Create a Vite Project
Vite is a front-end build tool and dev server. It includes Rollup to bundle and optimize assets. Run npm init vite and follow the prompts. As you can see in the screenshot below, I chose the default project name of “vite-project”.
This will create a folder named after your project and create some files and folders within it.
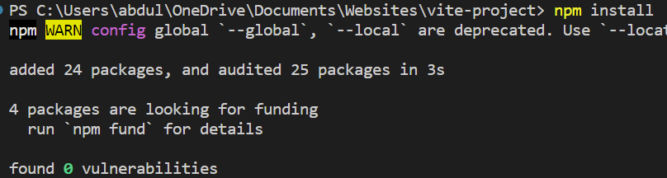
Then, as the instructions say, run the commands
cd vite-project
npm install
npm run dev
npm install will download the node packages specified in the package.json file into the node_modules folder.
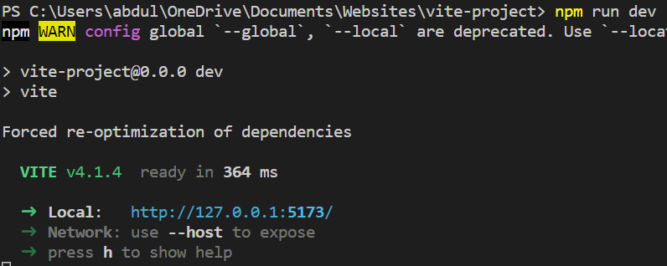
Start Dev Server
npm run dev will launch a dev server. Running the dev script starts a program called Vite. Vite’s job is to take your application’s source files, pass them to other programs (including Svelte, in our case) and convert them into the code that will actually run when you open the application in a browser.
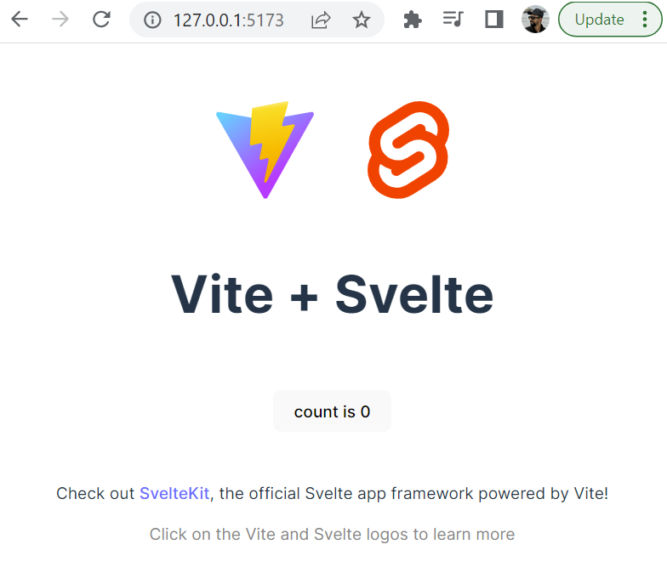
If you go to the local URL http://127.0.0.1:5173/, you will see the starter Svelte app that was created automatically.
The app includes a simple interactive counter. When you click the button, the counter increments.
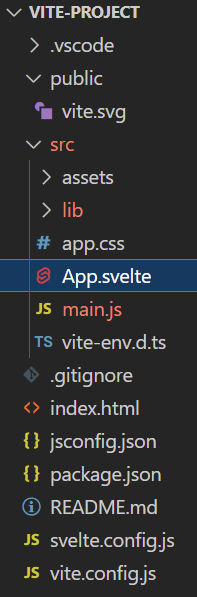
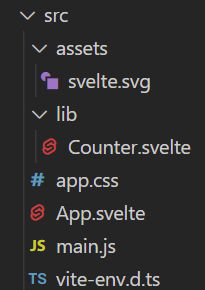
src Folder
If you look at the src folder, you’ll see a few files:
The assets folder contains static assets, like images
The lib folder contains Svelte components. In this case, there’s the counter component.
app.css is a global CSS file for the entire app
App.svelte is your main app code. In this case, it imports the svelte.svg logo and the Counter component.
<script>
  import svelteLogo from './assets/svelte.svg'
  import Counter from './lib/Counter.svelte'
</script>
main.js is the main JavaScript file. It loads your app’s CSS (app.css) and your app’s main code (App.svelte). It will also load the app in the HTML element with ID app.
import './app.css'
import App from './App.svelte'

const app = new App({
  target: document.getElementById('app'),
})

export default app
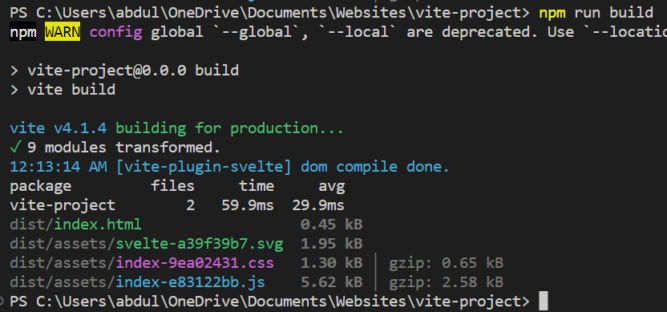
Build the App for Production
When you’re done developing your app (creating components, etc), you can run a build. This will bundle all CSS and JS files into a single CSS and JS file, optimize the bundle (e.g. minify it), and output the production files in the dist (distribution) folder. Run a build with the following command.
npm run build
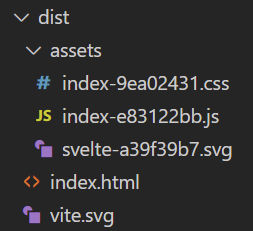
You’ll see a dist folder created. In this case, with the following files:
If you open index.html, you’ll see it references the two bundled CSS and JS files along with a div element with ID app where the app will be injected.
There are many different types of website content management systems. This post will explain the different types and include some examples.
No-Code CMS
A no-code CMS is one where the entire website is managed by the CMS. For example, with webflow, all changes to your website must be done in the CMS using a WYSIWYG. You can only edit the HTML of the code widget. All other changes must be done using the UI. If you want to edit the source code of the entire site, you must export the entire site. But, you can’t import any changes you made from the export.
A database-driven CMS is one that stores some or all data in a database. For example, WordPress is one such CMS. Web pages and blog post content are stored in a database (usually mySQL). Unlike webflow, however, you can edit the source code of the web page templates. WordPress has a built-in versioning system, so you can see a history of changes made to a page.
A headless CMS is one that stores data remotely. Data is integrated with your website using an API. For example, Contentful is one such CMS. You can create custom content models in Contentful. Your website will need to access the data at a particular URL that returns JSON data. Your website will then need to consume that JSON data to process it to show it on a web page, e.g. by using a template engine. Data in Contentful is likely stored in a database.
A git-based CMS stores data in git version control. Unlike many of the other CMSs, this CMS connects to your git repository as a web developer does. It then shows an interface that allows content editors to make edits to files in the repo. CloudCannon is one such CMS. With CloudCannon, web developers can add the class “editable” to HTML tags with a page’s source code. Then, the content of those tags will be the only elements that content editors can edit.
Websites that are built using a static site generator (SSG) often include front matter. Frontmatter can come in different formats. One popular format is YAML. You can have YAML at the beginning of a page’s source code. Or, you can have a separate, standalone .yaml file. YAML contains contain name-value pairs, so they basically represent data. Netlify CMS is one type of CMS that supports editing YAML. It also supports editing pages like blog posts. However, unlike WordPress, where editors can add blocks of content to a page’s body, Netlify CMS requires the blocks of content to be predetermined upfront. So, for a blog post using Netlify CMS, editors can only use one widget to entire the entire body of the page. That widget is a rich text or markdown editor.
The CMSs above can be categorized as CMSs that support structured and unstructured data. CloudCannon supports unstructured data because you can let editors edit specific elements of a complex page by marking those elements as “editable”. YAML and database-backed CMSs support structured data because there is a clear name/value mapping.
My Preference
Since WordPress is the most popular CMS and it allows editors to add blocks of different types of content to the body of a page, I think it’s worth using. However, I don’t like that WordPress keeps data in a database and relies on PHP to build pages before serving them. Also, not all pages need to be edited by non-technical people. In fact, most pages will still be edited by developers who need full access to the source code. To accommodate the needs of both developers and non-developers, I would use GitHub to version all code changes and I would use a static site generator like Eleventy that is integrated with WordPress using the WordPress API. When a WordPress editor saves or publishes a page, WordPress can trigger a save_post() action with a callback function that calls a URL, e.g. a PHP script on Heroku at myapi.com/?postid=123.
function call_commit_script( $post_id ) {
    $remote_url = 'https://www.myapi.com/?postid='.$post_id;
    $access_token = '3&^&2lhl3@#lsjk756'; //some secret password
    $args = array(
    'headers' => array(
       'Authorization' => 'Bearer ' . $access_token,
       ),
     );
    $response = wp_remote_get( $remote_url, $args );
    if ( is_array( $response ) && ! is_wp_error( $response ) ) {
        $headers = $response['headers']; // array of http header lines
        $body    = $response['body']; // use the content
    }
    $post_title = get_the_title( $post_id );
    $post_url = get_permalink( $post_id );
    $subject = 'A post has been updated';
    $message = "A post/page has been updated:\n\n";
    $message .= $post_title . ": " . $post_url\n\n$body;
    // Send email to admin.
    wp_mail( 'webmaster@qualys.com.com', $subject, $message );
}
add_action( 'save_post', 'call_commit_script' );
The PHP script on Heroku could then
verify the Authorization Bearer header contains the predetermined access token value, e.g. 3&^&2lhl3@#lsjk756. If it doesn’t, then the request didn’t come from an authorized origin and should be rejected.
pull any latest changes from GitHub
call the WordPress API to get the page content in JSON format, e.g. https://www.mywordpresssite.com/wp-json/wp/v2/pages/123
commit the JSON data to GitHub
use the static site generator to build the page using the JSON data as the data source
Note: the PHP script on Heroku, e.g. https://www.myapi.com/?postid=’.$post_id, must be secured by SSL/TLS to encrypt the URL and headers so that attackers can’t see the authorization header value.
For allowing non-technical people to
edit simple YAML files or frontmatter, I’d use Netlify CMS.
edit complex, structured data, I’d use Contentful.
edit specific, unstructured content, I’d use CloudCannon.
This tutorial will guide you to create a documentation website using Github and Netlify using the MkDocs static site generator. Even though MkDocs is designed for documentation, it can be used to quickly create simple websites with a navigation menu. Since I’m on Windows, this tutorial is for users on Windows.
Let’s create a folder where our website project will be. I’ll call mine mkdocs at C:\Users\abdul\OneDrive\Documents\Websites\mkdocs.
Install Python
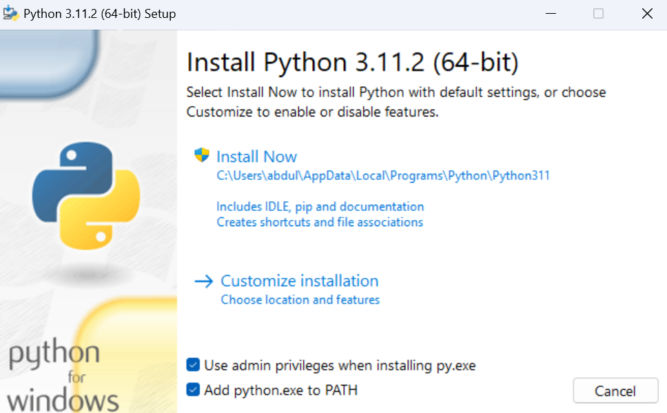
If you don’t have Python installed, you’ll need to install it. Visit Python and download the executable. When installing, be sure to check the box to “Add python.exe to PATH” is checked.
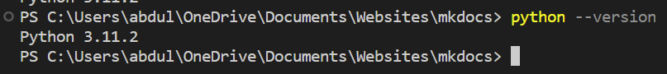
Verify python was installed by running
python --version
You may need to close and reopen the command prompt for this to work.
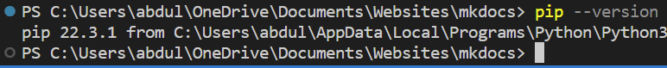
Install pip
pip is a package manager for python. If you just installed python, then pip will likely be installed. Test this by running the following command
pip --version
I have pip version 22.3.1. This version may be out of date, so let’s update it with
python.exe -m pip install --upgrade pip
Now, when I run pip --version, I see a newer version installed.
Create a Virtual Environment
A python virtual environment is a tool that helps to keep dependencies required by different projects separate by creating isolated python virtual environments for them. This is one of the most important tools that most Python developers use. In a terminal, go to your project folder and run the following command. venv can be any name you want.
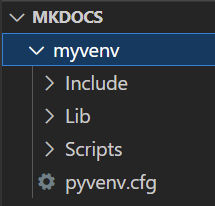
python -m venv myvenv
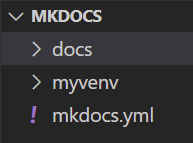
This creates a folder called myvenv in your project folder containing a bunch of folders and files.
Activate Virtual Environment
Now we need to activate our virtual environment. Remember: this must be done every time you begin working on your project. You’ll know you’ve activated the virtual environment if the command prompt prefix shows the name of your virtual environment.
Windows
On Windows, we have to activate it by moving into the virtual environment folder and running Scripts\Activate.
Notice how the command prompt prefix is now myvenv.
Linux/Mac
If you’re on Linux or Mac, use the following command from the project root folder.
source myvenv/bin/activate
where myvenv is whatever name you gave your virtual environment.
Install mkdocs-material theme
You can have different themes with mkdocs. The best theme is mkdocs-material so we’ll install that one. Go back to your project root folder and run the following command.
pip install mkdocs-material
This will download the mkdocs-material dependencies in myvenv\Lib\site-packages folder.
Create a New mkdocs Site
Now, let’s create a new mkdocs site by running the following command in our project root folder.
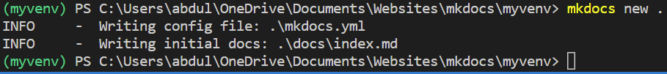
mkdocs new .
This will create 2 files.
mkdocs.yml is a configuration file.
index.md is a documentation page.
Preview the Site
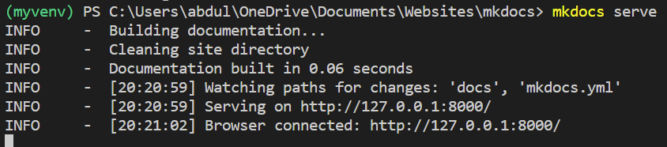
MkDocs comes with a built-in dev server that lets you preview your documentation as you work on it. Make sure you’re in the same directory as the mkdocs.yml configuration file, and then start the server by running the following command:
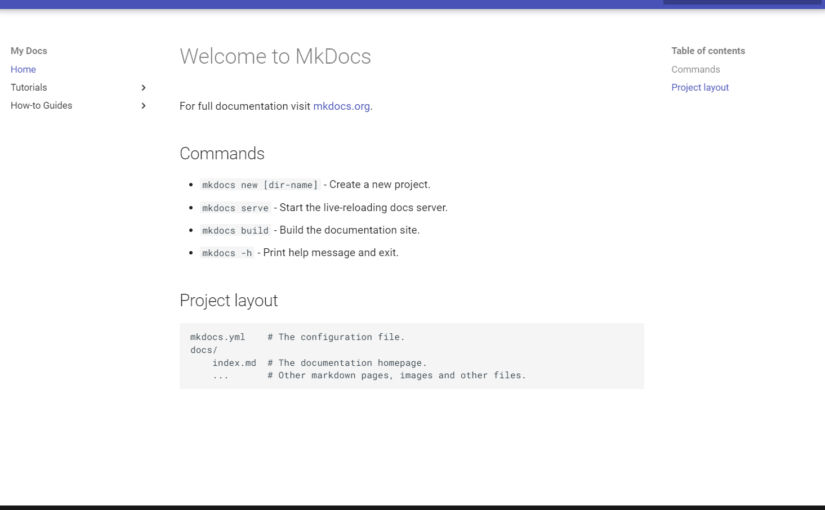
mkdocs serve
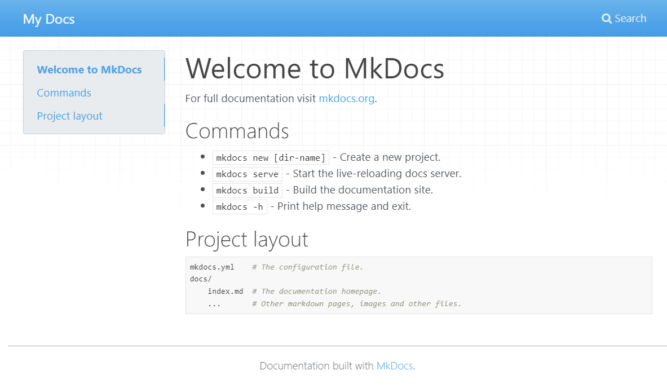
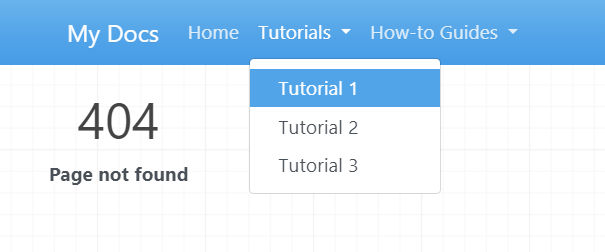
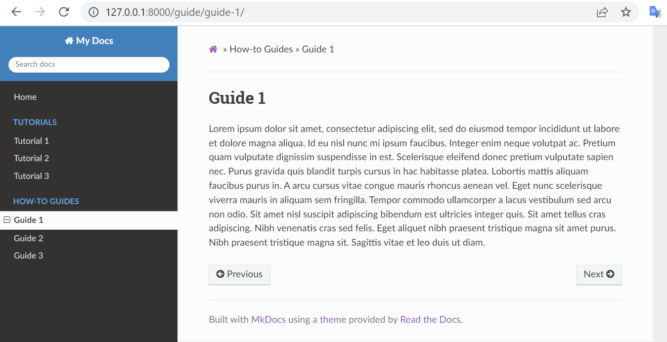
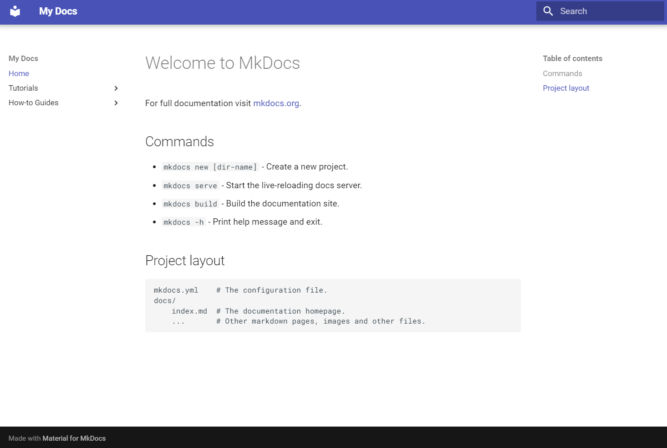
Now we have a dev server. If you open http://127.0.0.1:8000/ in a browser, you’ll see the index page.
Customize The Site
Open mkdocs.yaml to make the following changes.
Change Site Name
The default site name is “My Docs”. You can change it here.
site_name: My Docs
Add Pages to Site
Add an order, title, and nesting of each page in the navigation header by adding a nav setting. For example,
So far, we’ve been previewing the changes to the site. There are still only 2 files. Let’s build the site. In another terminal window, run the following command.
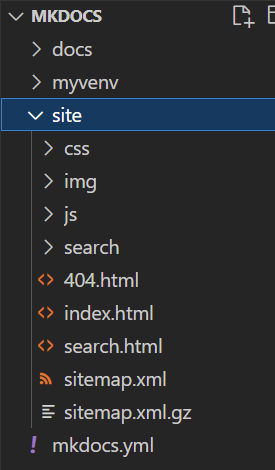
mkdocs build
This creates a site folder containing the built HTML files and other files.
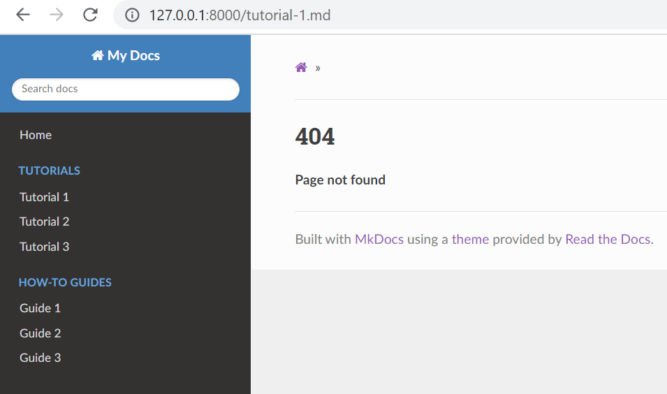
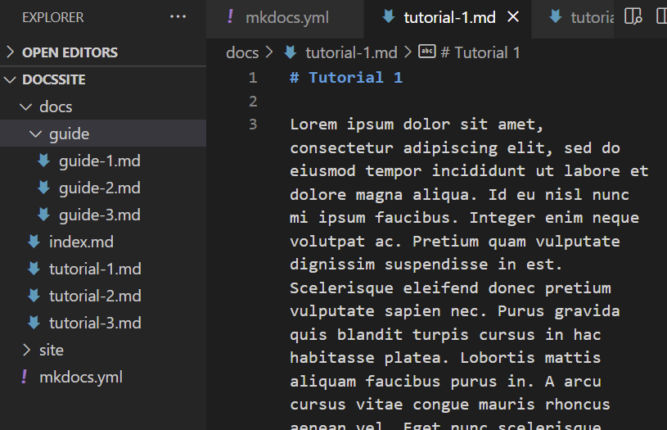
Create Pages
We have our nav menu, but we don’t have pages the nav links to. Let’s create those pages now. The file name and path should match what’s in the mkdocs.yaml config file and the source files should be in the docs folder. I just created some placeholder page content for demonstration purposes.
Now, our documentation website is starting to look good.
Change the Theme to the Material Theme
Let’s change the theme to the Material theme by updating the mkdocs.yaml file.
theme:
    name: material
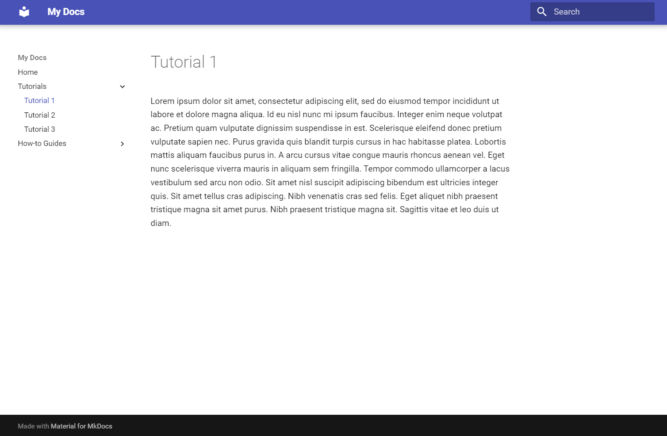
When you do this, your dev server may crash. Just restart it with mkdocs serve. And just like that, our theme is now the Material theme.
Customize the Theme
You’ll notice that in your source code, there are no theme files. There are different ways you can customize the theme as described in the official manual. You can also create a new theme. Theme files use the Jinja2 templating engine.
Deploy to Netlify
In order to deploy to Netlify, we need
runtime.txt (a file that specifies the version of python to run)
requirements.txt
netlify.toml
GitHub account
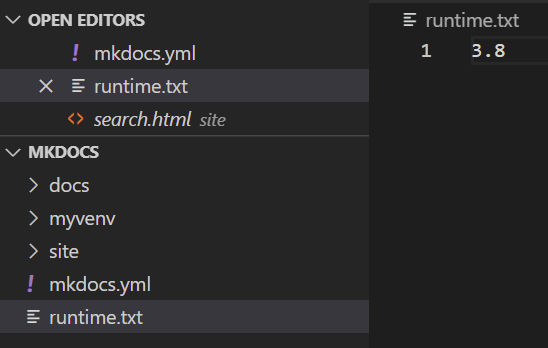
Create runtime.txt
Create a file in the project root with the version of python you want Netlify to use when building the site. The current latest version of python that Netlify supports is 3.8. The version number must be x.y (major and minor versions only, no patch numbers).
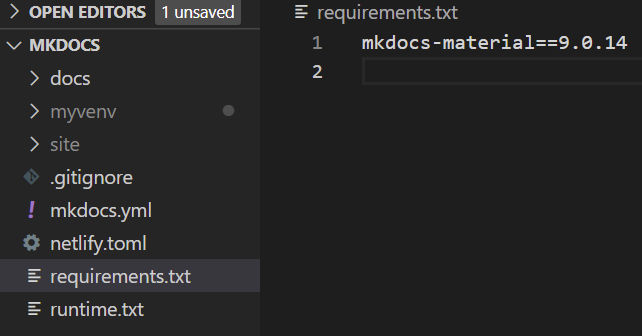
Add requirements.txt
This file will list software dependencies and versions. Create a requirements.txt file with the following
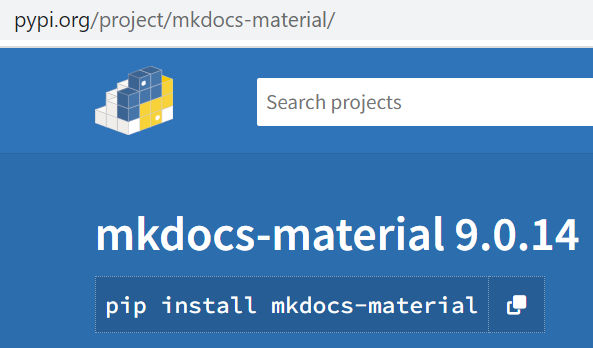
mkdocs-material==9.0.14
You’ll end up with a requirements.txt file similar to this. 9.0.14 is the current version of mkdocs-material pip package at https://pypi.org/project/mkdocs-material/.
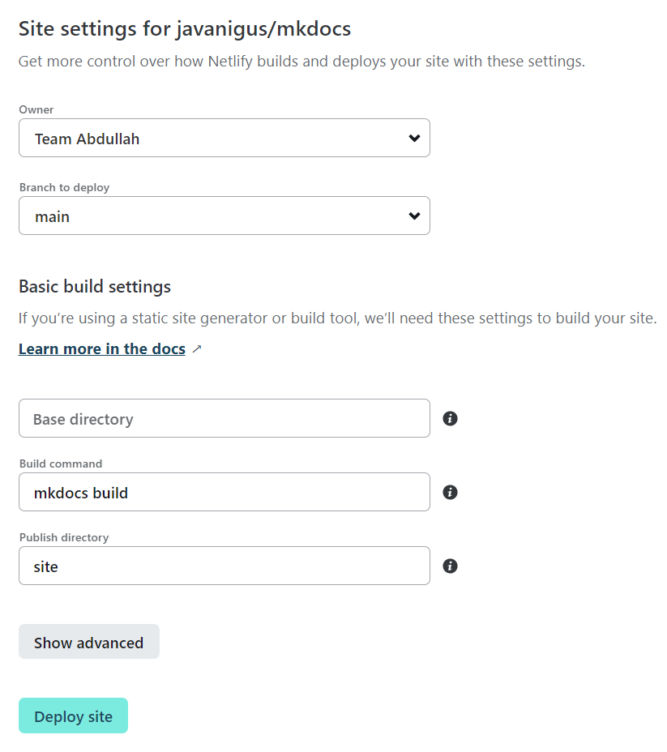
Create netlify.toml
netlify.toml is a Netlify configuration file. Create the file and add the following to it.
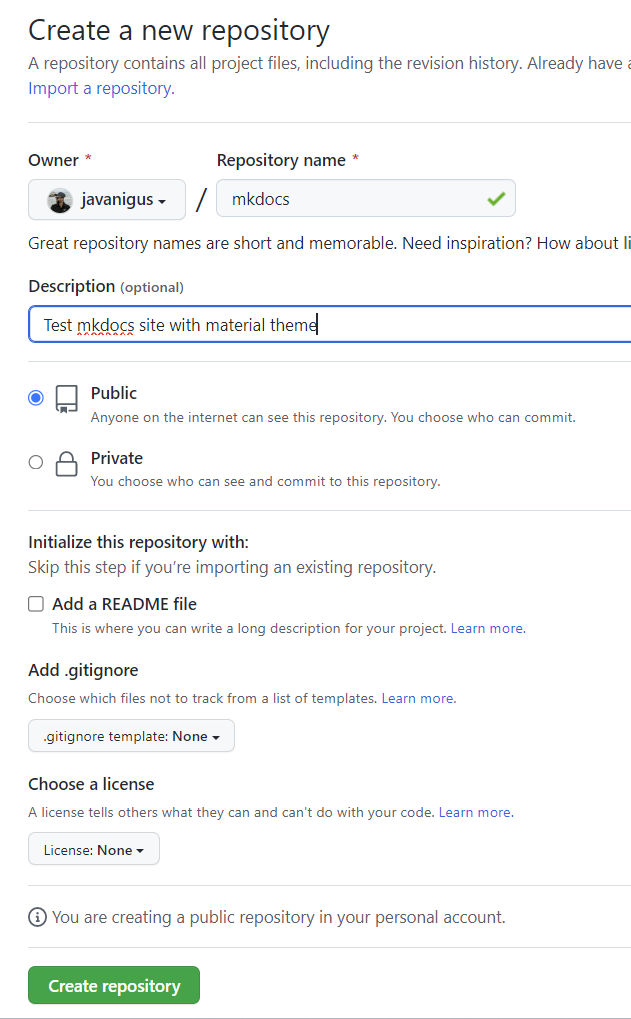
To avoid errors, do not initialize the new repository with README, license, or gitignore files. You can add these files after your project has been pushed to GitHub.
Initialize the local directory as a git repo. If you don’t have git installed, you’ll need to install it first.
Run git init -b main in our project folder. This will create a hidden .git folder.
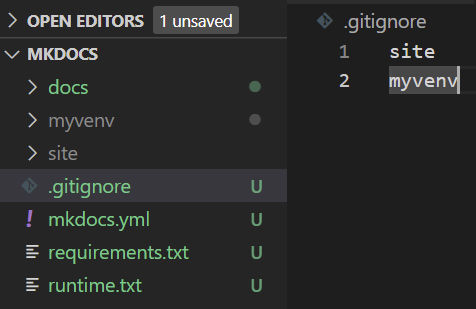
Create a .gitignore file with the following entries to ignore them from being tracked by git.
site
myvenv
Add the files in your new local repository. This stages them for the first commit.
git add .
Commit the files that you’ve staged in your local repository.
git commit -m "First commit"
At the top of your repository on GitHub.com’s Quick Setup page, click to copy the remote repository URL.
Svelte is similar to React and Vue, but instead of doing most of the work in the browser, Svelte does it in a compile step. Also, Svelte doesn’t do virtual DOM diffing or require HTML/CSS within JavaScript. Here’s a video showing code to create a simple to-do list app using 10 different JavaScript frameworks. Personally, I find the Svelte code to be the simplest and most elegant.
UPDATE: You can quickly set up preconfigured web stacks using Amazon Lightsail.
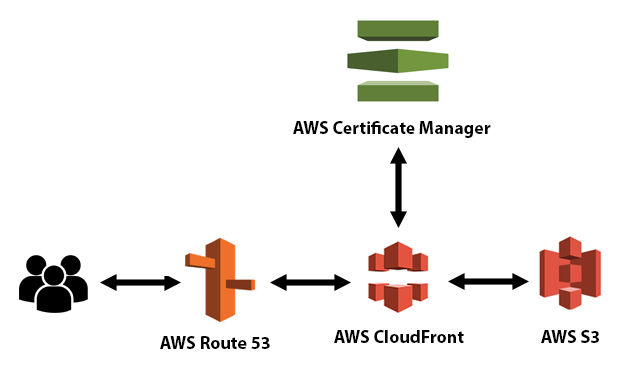
This tutorial will show you how to host a website on Amazon S3, Amazon CloudFront, and Amazon Route 53 using SSL and a custom domain.
Amazon S3 Amazon S3 is an object storage service. Files are objects.
Amazon CloudFront Amazon CloudFront is a content delivery network (CDN) service.
Amazon Route 53 Amazon Route 53 is a Domain Name System (DNS) web service. Route 53 connects user requests to internet applications running on AWS or on-premises.
AWS Certificate Manager AWS Certificate Manager (ACM) is used to provision, manage, and deploy public and private SSL/TLS certificates for use with AWS services and your internal connected resources. ACM removes the time-consuming manual process of purchasing, uploading, and renewing SSL/TLS certificates.
Create an S3 bucket
Go to your AWS console and search for S3. Click it.
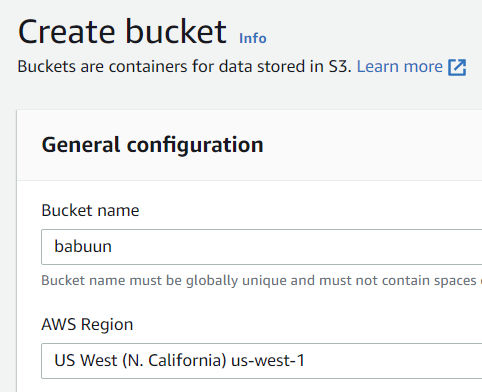
Click ‘Create Bucket’. Choose a globally unique bucket name and AWS region.
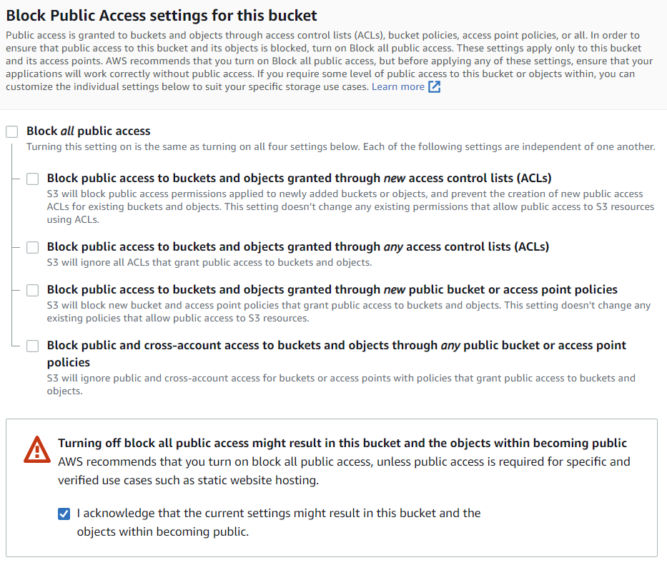
Untick “Block all public access” and confirm it, since we want our static website accessible from the internet.
Leave everything else as is and click ‘Create bucket’.
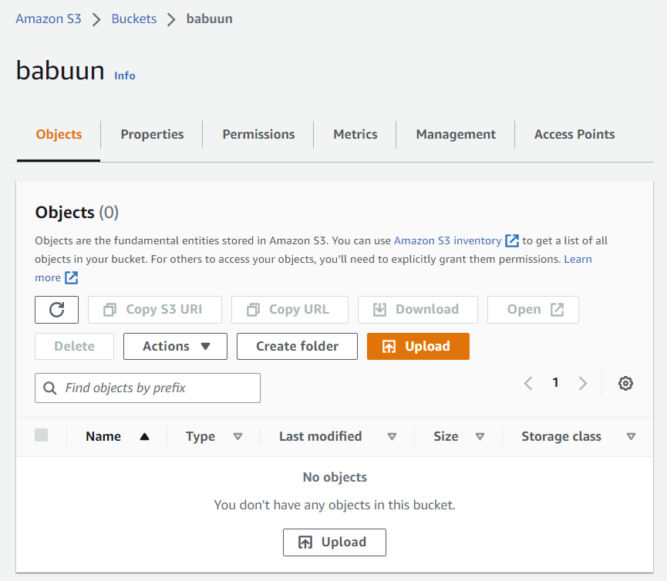
Open the bucket you just created from the console. The bucket should be empty.
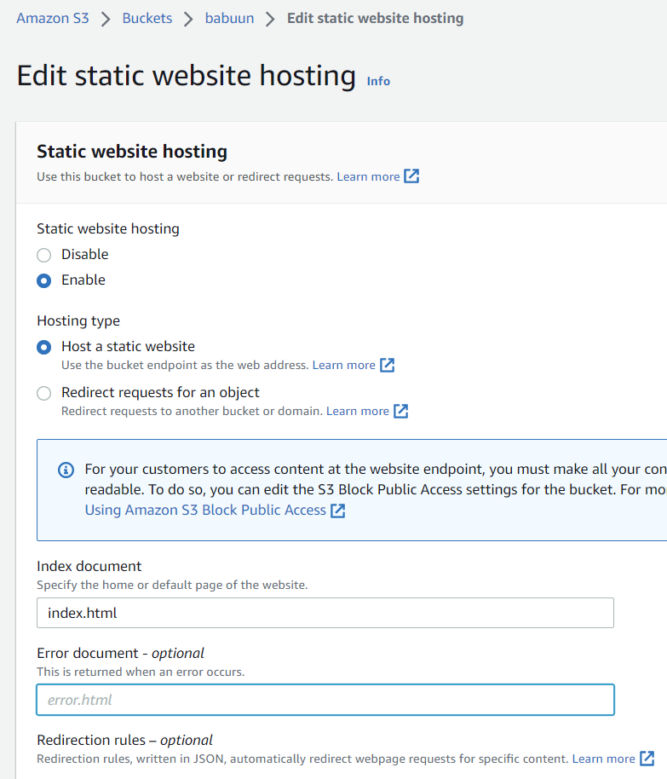
Click the Properties tab, and then sroll down to Static website hosting and click ‘Edit’.
Choose ‘Enable’ under “Static website hosting”
Choose “Host a static website”.
Choose an Index document. You can fill in “index.html”.
Hit Save changes.
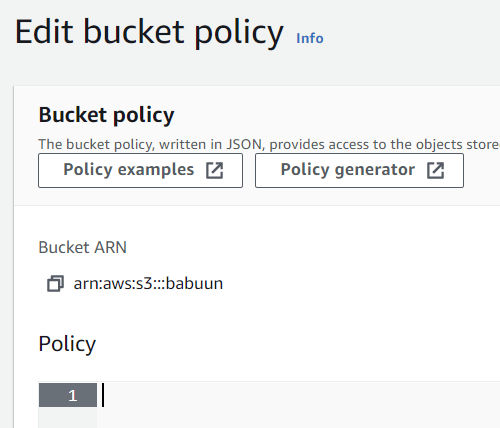
In S3, click the Permissions tab. Then Bucket Policy.
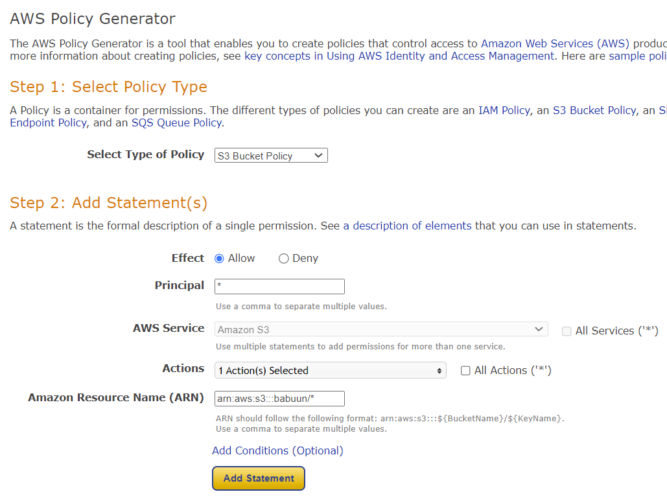
Here you need to fill in a policy that will allow the bucket to be publicly accessed. Open the official AWS policy generator at AWS Policy Generator in a new tab and generate a policy.
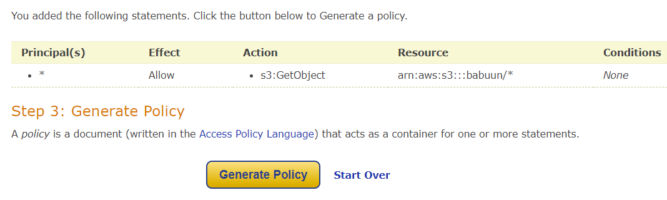
At the generator, choose S3 bucket policy as the Type of Policy. Principal will be an asterisk “*” (without quotes), and Actions will be “GetObject”.
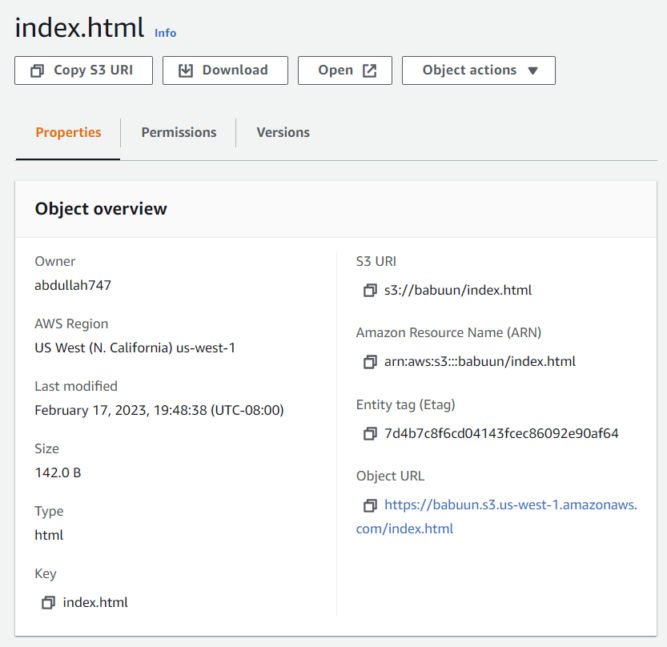
Fill in your ARN. It can be found in AWS Console where you were about to fill in the bucket policy. There, at the top of the page, you should be able to find the ARN in the format of arn:aws:s3:::<bucket_name>.
Important: before you paste in the ARN, append a slash and asterisk at the end, so it will look something like: arn:aws:s3:::babuun/* (my bucket name is “babuun”). This will allow access to everything inside the bucket.
Click Add Statement and then Generate policy.
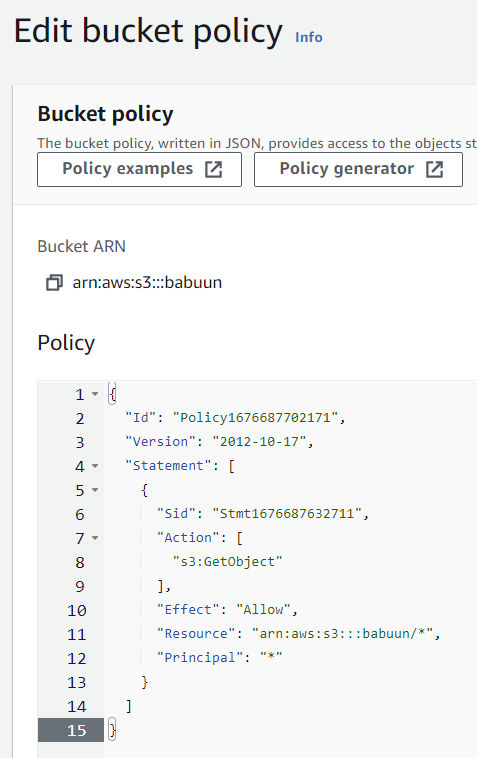
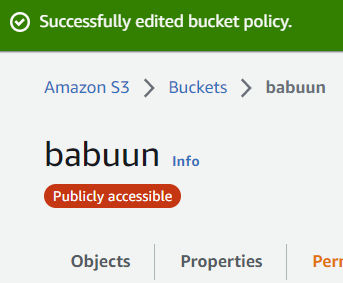
Copy the whole policy over to the S3 AWS console in the Edit bucket policy page and click Save Changes.
Now, when you open your bucket, you should see a red bubble with white text Publicly accessible under the name of your bucket. If you do, everything is correct and we can proceed.
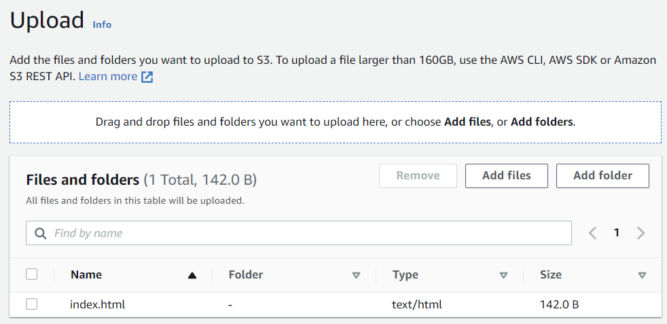
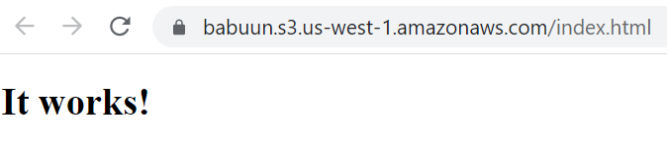
In your AWS console inside your S3 Bucket hit Upload, then Add files and upload your website. If you don’t have one yet, just create an index.html file with the following content and upload it. You can also create a folder, e.g. for images.
In your AWS Console search for Route 53 under Services.
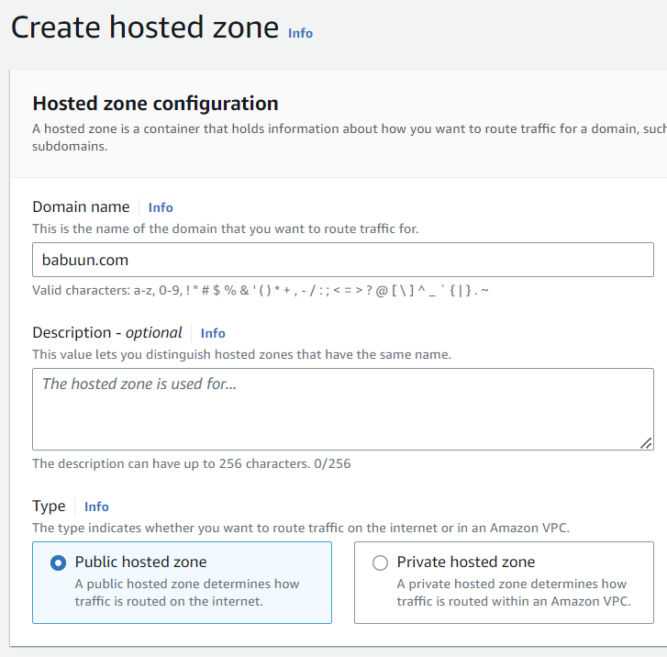
Under ‘DNS management’, click Create hosted zone.
Inside the ‘Domain name’ field, input your domain name. You can get one from any domain registrar like GoDaddy.
‘Type’ will be Public hosted zone.
Click Create hosted zone.
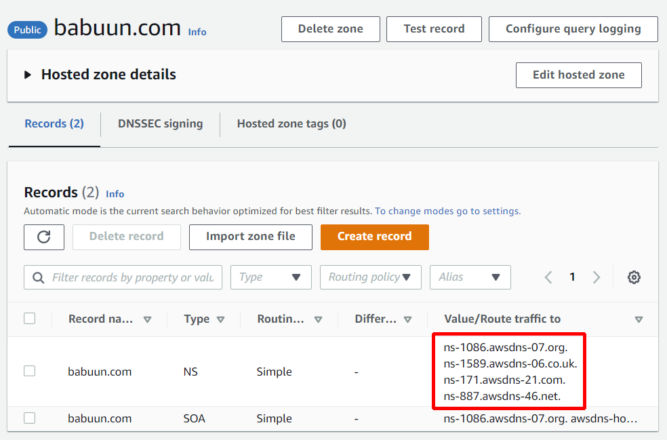
Now we need to link our domain with the records in Route 53. For the zone we just created, you’ll see 2 types of records. The first on is “NS”, which stands for “name server”. There are 4 name servers in this record.
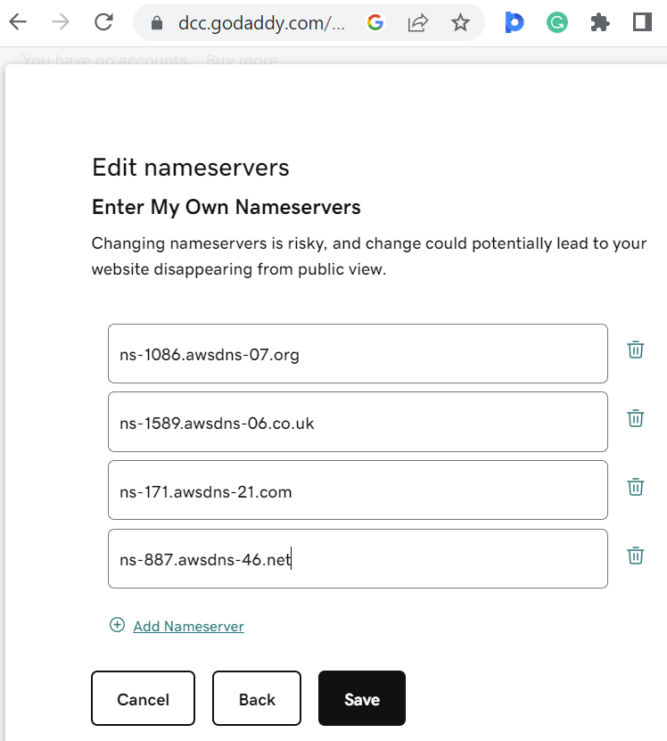
Open a new browser tab and go to your domain’s DNS management page. There, you’ll see a section to update nameservers. My domain is babuun.com and I registered it with GoDaddy. Copy the name server values in Route 53 to your DNS management page. Make sure to remove the dot at the end. In doing so, when someone tries to reach your domain, you redirect them to one of these name servers. Save your nameserver changes. Keep this browser tab open as you’ll need it in the next section.
Set up a certificate
In your AWS Console, search for Certificate Manager and click the link.
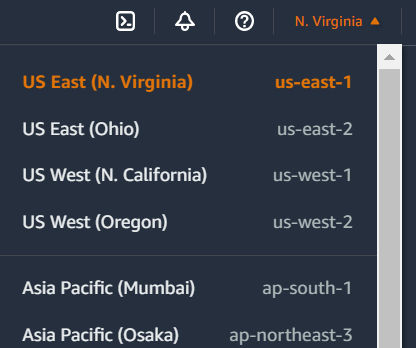
IMPORTANT: In the region dropdown, choose “US East (N. Virginia)”.
Click “Request Certificate” > “Request a Public Certificate”.
Fill in the domain name. In my case, it’s “babuun.com”.
For “Validation Method”, use the recommended value (DNS Validation).
Leave everything else as is and click the Request button.
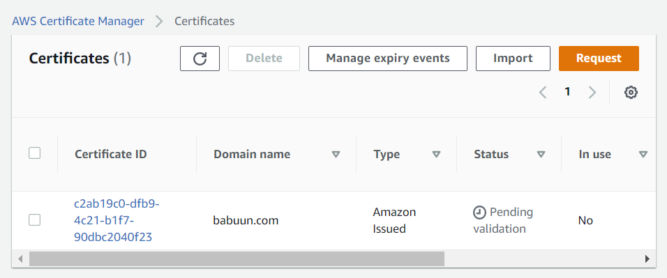
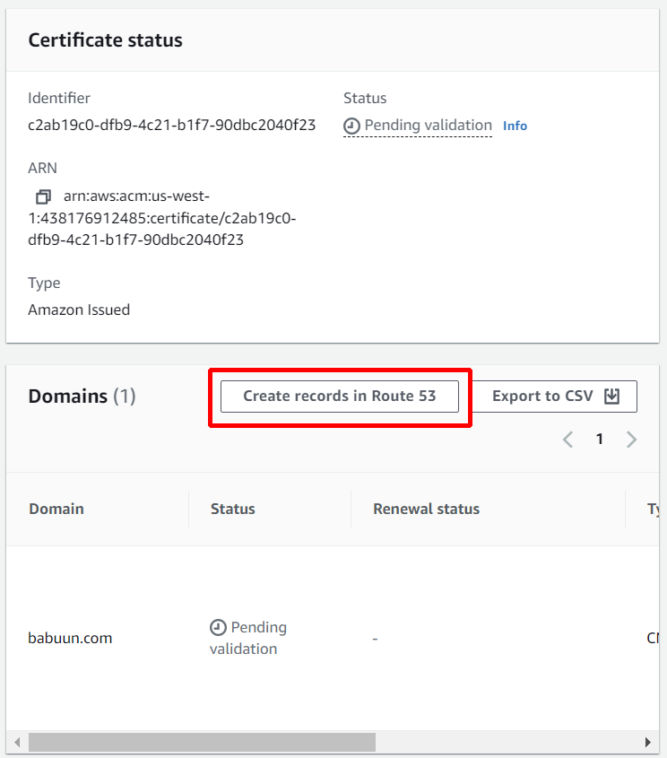
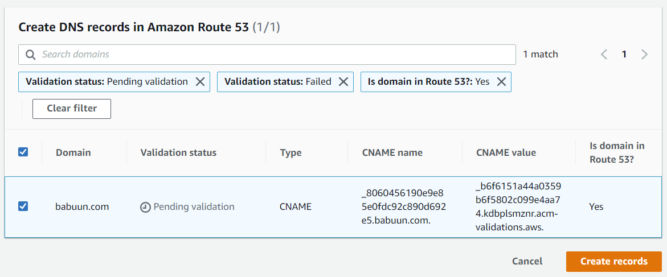
On the next screen, you’ll see the certificate is “pending validation”. In order to validate it, we need to link it to our Route 53 records. Click on the link under “Certificate ID”.
Click on “Create records in Route 53”.
Then, click the “Create records” button.
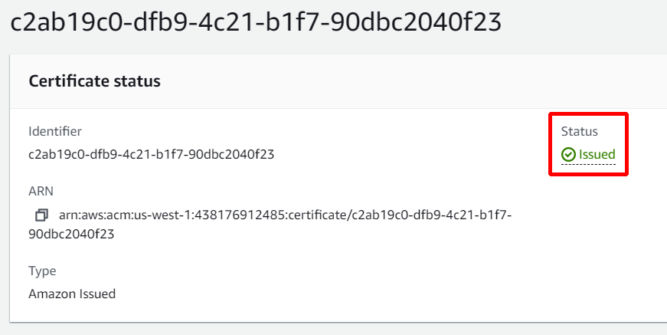
Wait up to 30 minutes for the certificate to be issued. The status will change from “Pending validation” to “Issued”.
Set up a CloudFront distribution
We will create a CloudFront distribution that is connected to our S3 bucket. When anyone tries to access our distribution, they will actually be accessing our S3 bucket while taking advantage of the speed of CloudFront.
In your AWS Console search for CloudFront and click the link.
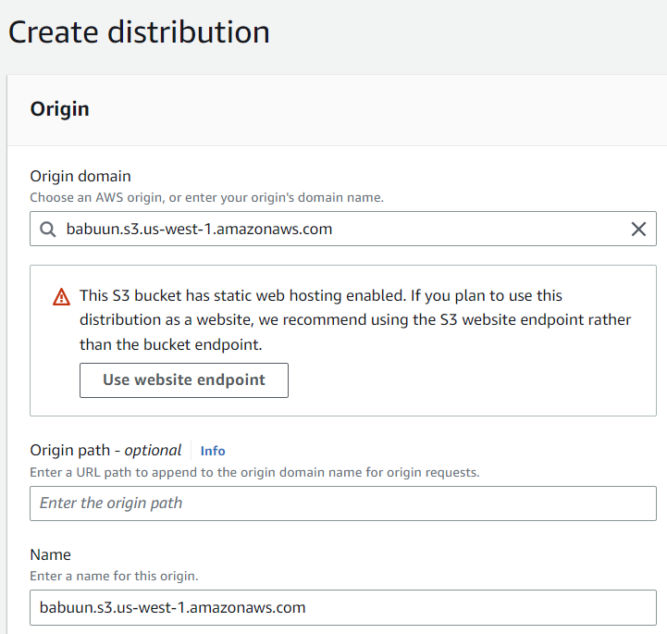
Click Create Distribution. On the next page, under “Origin domain”, select the S3 bucket we created earlier.
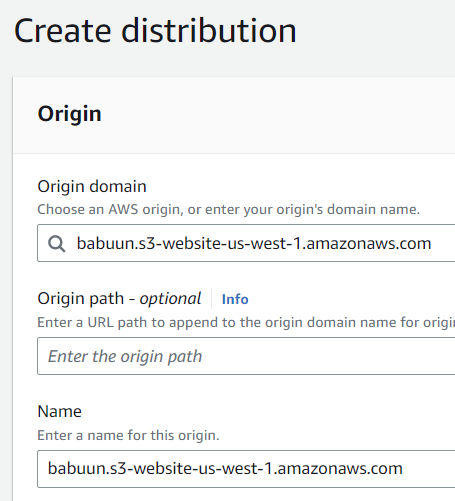
CloudFront will notice that the bucket was set up to host a website. Click the “Use website endpoint” button. CloudFront will automatically update the values for you.
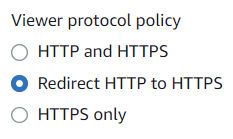
Under Viewer Protocol Policy choose Redirect HTTP to HTTPS
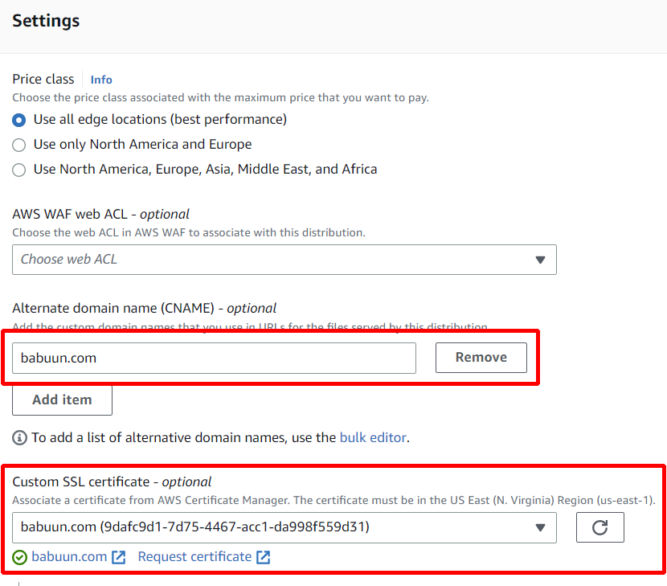
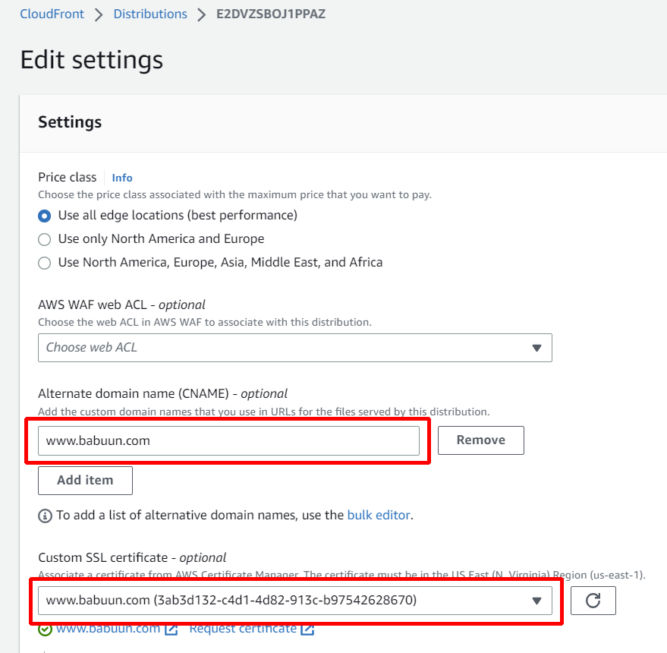
Under “Alternate Domain Names (CNAMEs)”, enter your domain name, e.g. babuun.com.
Under “Custom SSL certificate”, choose the certificate we created earlier. If it’s not available, the certificate may not have been issued yet. Wait 30 minutes or so and click the refresh button until you see the certificate. Select the certificate.
Click Create Distribution at the very bottom of the page.
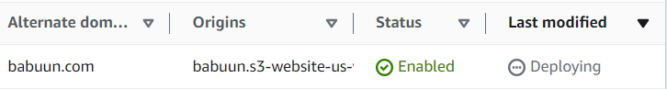
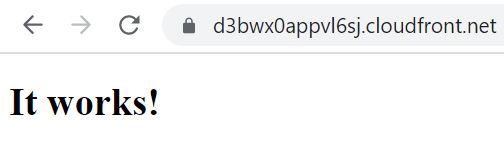
The distribution takes about 10-20 minutes to provision. Once it is provisioned (Status = Enabled, Last modified = a date), you can test it by pasting the URL into your browser. You should see the website you uploaded into S3.
However, your custom domain won’t load in a browser yet. To fix that, we need to create a record in Route 53.
Set up a record in Route 53
Go back to Route 53 and click on your domain.
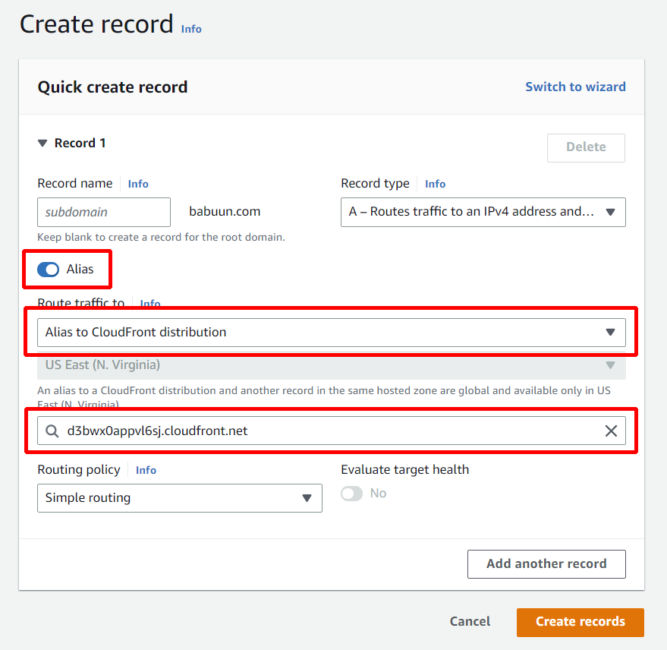
Click Create record.
Click Alias.
Click the dropdown menu at Value/Route traffic to and choose Alias to CloudFront distribution.
Choose the distribution you provisioned previously.
Notice that the only available region is US East (N. Virginia)[us-east-1]. This is due to the fact that we provisioned an SSL Certificate via AWS Certificate manager. This service is only available in US East 1.
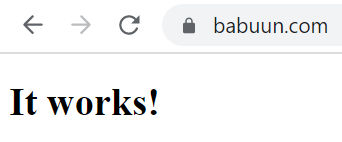
Now, just wait a few minutes for the DNS records to update and try to load your domain name. If everything went correctly, you should see your static website distributed via CloudFront.
And there it is…
Alternate Domain (CNAME)
The instructions above involve using Route 53 as the DNS manager for the domain by updating the nameservers for the domain at the domain registrar to point to AWS’ nameservers. By having Route 53 manage the DNS records, you can have the root domain (babuun.com) point to AWS CloudFront and you can add a CNAME (alternate name) such as www.babuun.com point to AWS CloudFront as well. So, your website would be accessible at both https://babuun.com and https://www.babuun.com.
If you don’t want to use AWS Route 53 as your DNS manager, you would only be able to create a CNAME in your external DNS manager that points to your CloudFront URL as shown below.
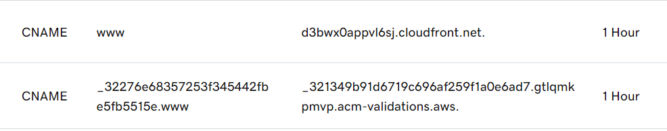
In this example, I made www.babuun.com point to d3bwx0appvl6sj.cloudfront.net in GoDaddy.com’s DNS manager. You can’t have the root domain (babuun.com) point to CloudFront because the root domain destination can only be set in the A record, which must point to an IP address, not a domain. Since we don’t know the IP address of CloudFront, then babuun.com will not point to CloudFront. As a workaround, you could have the root domain point to an IP address of a server you have access to, and then add a redirect from there to www.babuun.com.
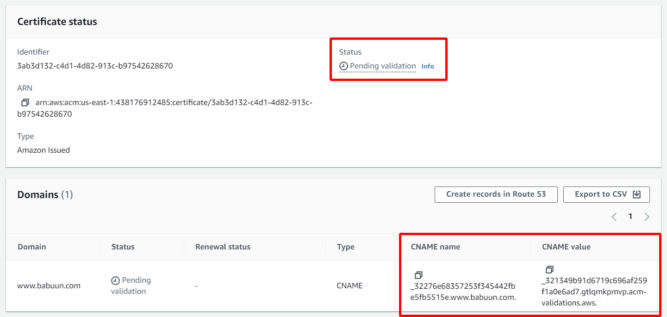
Since you’ll need a certificate specifically for www.babuun.com, or use a wildcard cert like *.babuun.com, you need to create a new certificate in ACM. The instructions are the same as above. After requesting a new certificate, you’ll see the status is “Pending validation”. Since you chose DNS validation, you’ll need to create a new CNAME record in your external registrar with the CNAME name and value provided.
The screenshot below shows the relevant records in my DNS manager on GoDaddy.
ACM will take up to 30 minutes to verify the changes after which time the certificate’s status will change to “Issued.
Now that the certificate is issued, you can update the CloudFront distribution settings by adding the newly issued certificate.
If you are using AWS CloudFront only for static assets, e.g. PDFs and images, then it makes sense to just create a CNAME record with an alternate name like “cdn.babuun.com” or “static.babuun.com” or “assets.babuun.com”.
Bucket Versioning
Versioning is a means of keeping multiple variants of an object in the same bucket. You can use versioning to preserve, retrieve, and restore every version of every object stored in your Amazon S3 bucket. With versioning, you can easily recover from both unintended user actions and application failures.
In S3, choose your bucket, then click the Properties tab, then enable bucket versioning.