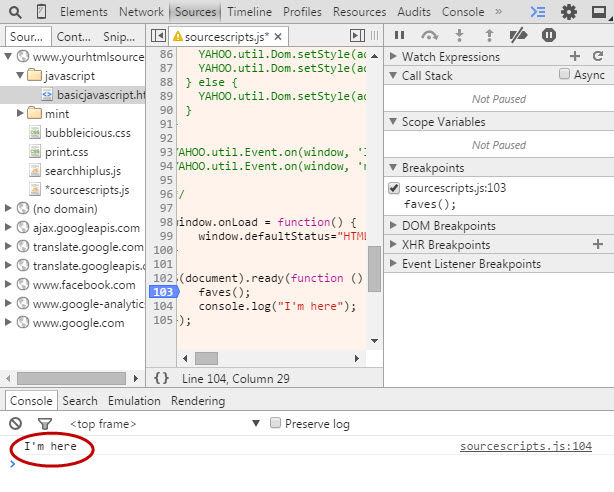
Debugging Javascript can be tricky. But, thanks to Google Chrome’s Inspector, it’s not so bad. You can edit your Javascript files directly in Chrome’s Inspector and run the code to quickly test and fix problems. Here’s how to do it.
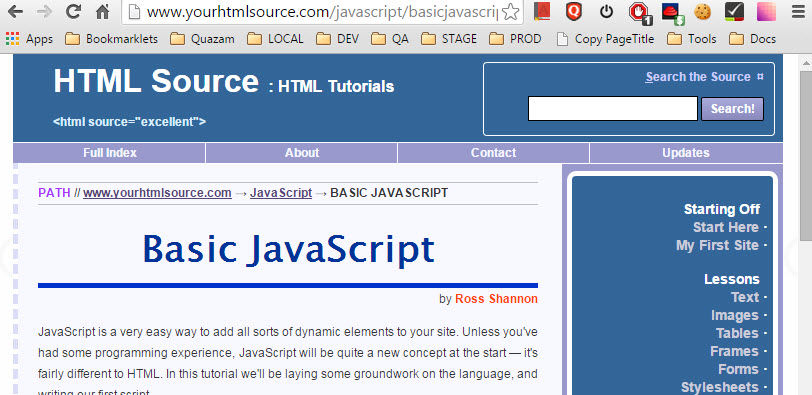
1. Open a page that has Javascript included in a separate file. This example uses the website http://www.yourhtmlsource.com/javascript/basicjavascript.html.
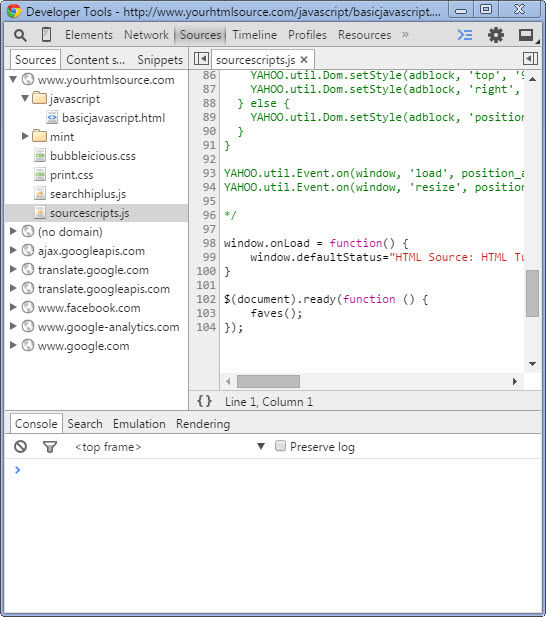
2. Next, open Chrome’s Inspector, click on the Sources tab, and click on a Javascript file. The file will open in the middle pane. Don’t click the pretty-print button { } as that won’t allow you to edit the Javascript code.
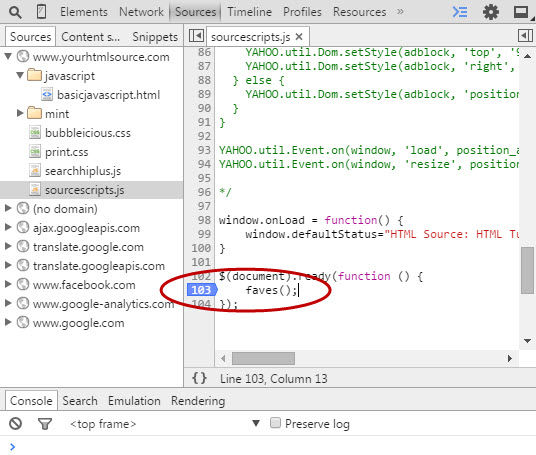
3. Set a breakpoint somewhere before where you want to start debugging. In this example, I’m going to put on right after the document.ready call. Click on the line number where you want the breakpoint to occur. It will turn blue.
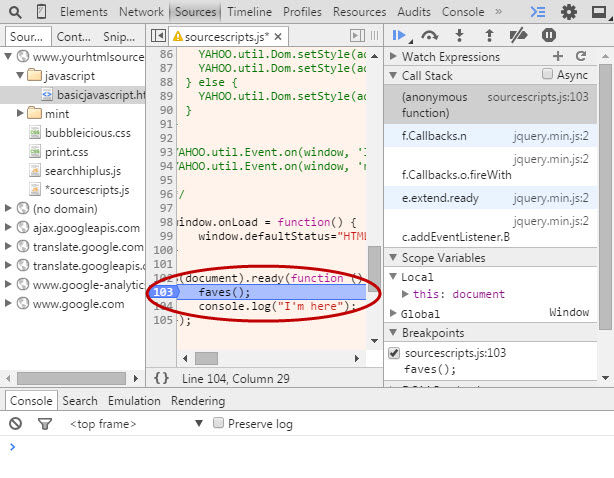
4. In your browser, reload the page. Execution will stop at the breakpoint. Then, in your inspector, type some test code somewhere in your code that will get called after that breakpoint and then click Save (Ctrl + S). In this example, I’m going to put a console.log(“I’m here”) statement just after my breakpoint.
5. Back in your browser, click the Play button. Notice that in your inspector’s console, the words “I’m here” is displayed.


