


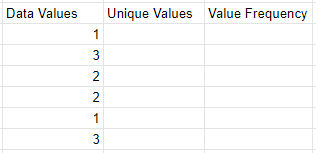
I’m often finding myself needing to calculate the frequency of unique values in a spreadsheet. It turns out it’s a 2-step process. For example, if you have a column of data as shown below and you want to know how many times the numbers 1, 2, and 3 occur, you need to first add a column containing the unique values in column 1. Then, you can use the frequency function to calculate frequency.
1. Get Unique Values
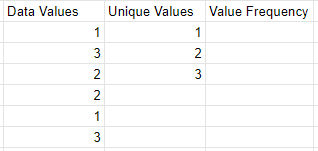
In column 2, get the unique values in column one using the unique function:
=UNIQUE(A2:A7)
If you want, you can also sort the values as follows.
=SORT(UNIQUE(A2:A7))
2. Get Value Frequency
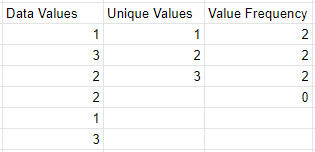
In column 3, get the value frequency using the frequency function. The data is in column 1 and the classes are in column 2.
FREQUENCY(data, classes)
=FREQUENCY(A2:A7, B2:B4)
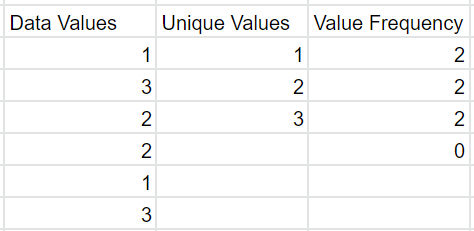
Google Sheets seems to want to add an extra row with the value 0. I just ignore that.